
Cryptocurrency has changed the vertical of currencies with maximum impact. Specifically, Bitcoin has managed to garner all the attention and market favoritism in recent times. Providing a new edge to currency exchange, Cryptocurrency is no more a hit and miss for the experts. With a lot of people getting on board with the idea of… Continue reading 9 Best Bitcoin And Cryptocurrency Plugins For WordPress
Tag: chart
Solving Problems With CSS Grid: The Gantt Chart

We recently published a tutorial explaining how to build a JavaScript-driven Gantt Chart. I think it’s the perfect case study for CSS Grid, so in this tutorial we’ll see how well suited CSS Grid Layout is for building a flexible Gantt Chart. Our CSS Grid Gantt Chart Here’s what we’re building. It uses CSS Grid… Continue reading Solving Problems With CSS Grid: The Gantt Chart
Illustrator Tutorials: 31 New Illustration, Drawing Vector Tutorials

Fresh free Adobe Illustrator tutorials to learn drawing, digital vector illustration and character illustrations. Adobe illustrator is widely used to draw illustrated portraits, background illustrations and many more useful illustrations. Illustrator Tutorials are the best way to learn how to create professional vector graphics and illustrations. These tutorials will provide’s a lot of help, step by step presentation of a thing… Continue reading Illustrator Tutorials: 31 New Illustration, Drawing Vector Tutorials
9 Popular WordPress Plugins that Designers and Developers are Using
The WordPress website and blog creating platform’s popularity just keeps on growing. It’s not just the numbers of new users that are flocking to WordPress give evidence of this popularity. It’s the thousands of themes and plugins that have been designed to work with the platform. As a result, WordPress keeps getting more flexible and… Continue reading 9 Popular WordPress Plugins that Designers and Developers are Using
The Anatomy of Flat CMS

With the advances in technology, users and search engines alike are demanding better and faster websites. Even Google is obsessed with speed on the web. Because of that, online services are also eager to improve their performances. And that’s where Flat-file CMS comes into the scene. When building a website, it can be confusing what solutions… Continue reading The Anatomy of Flat CMS
Download Free Mandala Business Cards (exclusive)

Our friends from Freepik shares today on Designbeep with all our readers a complete pack that includes an amazing variety of free Mandala Business Cards that you can use in your design projects. Each mandala card comes with .AI and EPS files and you can use,share or modify these cards both for your personal and… Continue reading Download Free Mandala Business Cards (exclusive)
7 New & Free WordPress Plugins
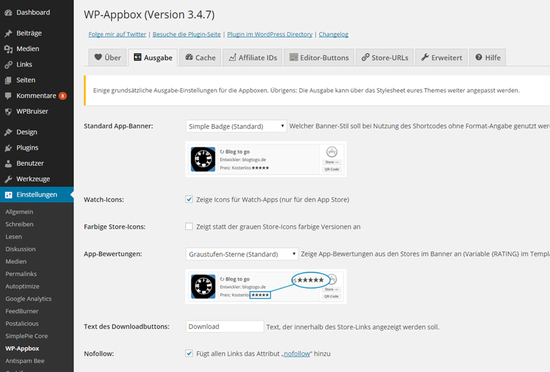
WordPress plugins are quite a useful commodity as they allow designers and developers to bring in some additional functionality into their website or blog. WordPress plugins are specially popular in designing community because of their widespread variety and easy availability. In this post, we are also presenting a fresh collection of 7 new and free… Continue reading 7 New & Free WordPress Plugins
Billboard.js – Re-usable Easy Interface JavaScript Chart Library
billboard.js is a re-usable easy interface JavaScript chart library, based on D3 v4+. Chart generation is super easy. With detailed options, you can create chart instantly. Billboard.js works on D3 v4+ and every code was written as ESM(ES Module) with ES6+ syntax. Billboard.js is forked project of the popular C3.js. You can migrate with the… Continue reading Billboard.js – Re-usable Easy Interface JavaScript Chart Library
How to Draw Bar Charts Using JavaScript and HTML5 Canvas
In an earlier tutorial we covered how to draw a pie chart or doughnut chart using HTML5 canvas. In this tutorial I will show you how to use JavaScript and the HTML5 canvas as a means to graphically display data by using bar charts. There are easier ways to create charts than coding one from… Continue reading How to Draw Bar Charts Using JavaScript and HTML5 Canvas
Designing Charts — Principles Every Designer Should Know

Use real data in your chart mock ups Designers have a tendency to create the most beautiful version of a chart possible without any regard to the real data that it needs to handle when it’s actually implemented. This can cause endless headaches for the developers trying to build this thing you designed, and even more… Continue reading Designing Charts — Principles Every Designer Should Know
Create Data Maps For Free with Datamaps.co
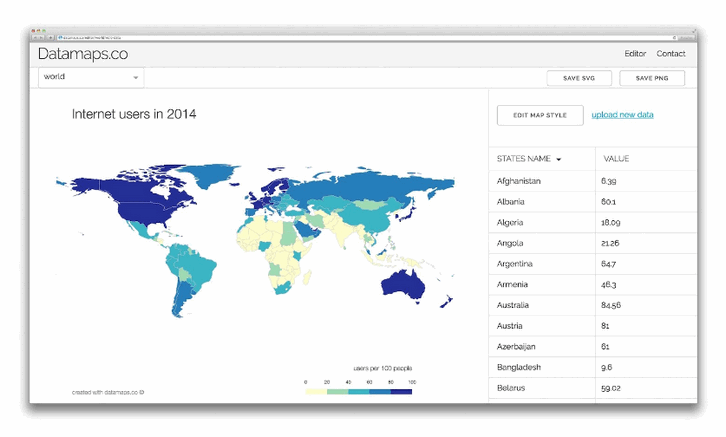
Posted · Category: License Free, Maps Datamaps.co is a free and simple platform for creating visualizations with data maps. It allows you to upload CSV file with region data, and fully customize your map’s appearance. Your map chart can be saved as PNG or SVG. With datamaps.co, you can create a custom map of World,… Continue reading Create Data Maps For Free with Datamaps.co
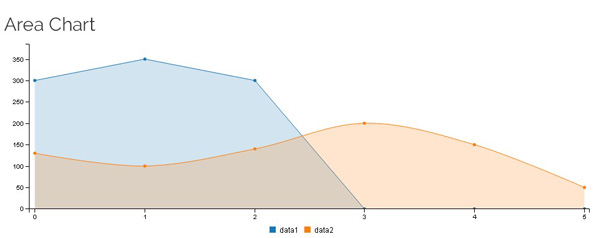
Chart.js A Simple yet flexible JavaScript charting for designers & developers
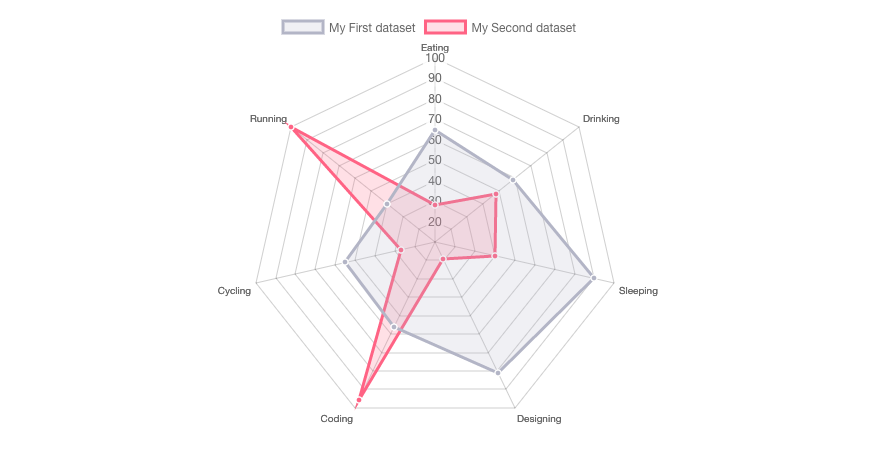
Chart.js was first introduced in year 2013, for 3 years of intensive development by many contributors, it has became quite a powerful open source Javascript charting plugin. It’s designed for both developers and designers. It supports 8 types of charts – Line, Bar, Radar, Polar Area, Pie & Doughnut, Scales charts. With version 2.0, you… Continue reading Chart.js A Simple yet flexible JavaScript charting for designers & developers
Chartd – Responsive and Retina-Compatible Charts
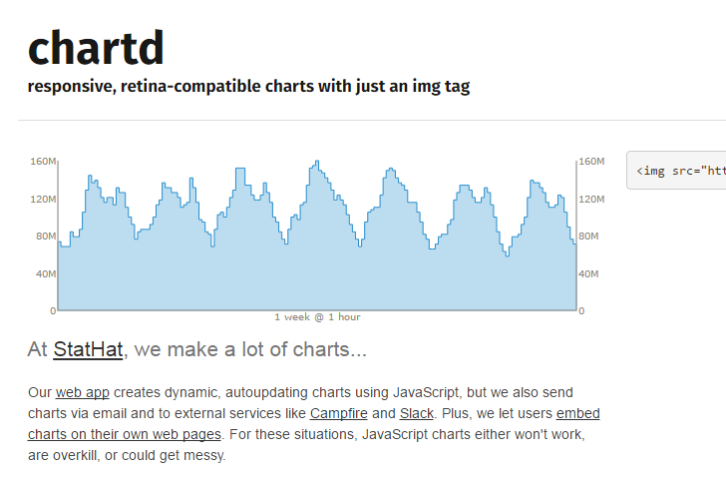
Advertise here via BSA At StatHat, they make a lot of charts. They creates dynamic, autoupdating charts using JavaScript, but we also send charts via email and to external services like Campfire and Slack. Plus, they let users embed charts on their own web pages. For these situations, JavaScript charts either won’t work, are overkill, or could get… Continue reading Chartd – Responsive and Retina-Compatible Charts
The Recently Released Webdev Resources You Would Need
Want to use Vanilla JS but find native APIs a bit unwieldy? Bliss is for you. Bliss is just a collection of helpers and light syntactic sugar over Vanilla JS. It does not account for browser bugs or lack of support of certain APIs, although it only uses features that are both supported across most… Continue reading The Recently Released Webdev Resources You Would Need
Data Structures With JavaScript: Tree
What You’ll Be Creating * { box-sizing: border-box; } body {margin: 0;}*{box-sizing:border-box;}body{margin-top:0px;margin-right:0px;margin-bottom:0px;margin-left:0px;} Trees are one of the most commonly used data structures in web development. This statement holds true for both developers and users. Every web developer who has written HTML and loaded it into a web browser has created a tree, which is referred… Continue reading Data Structures With JavaScript: Tree
Build a Dynamic Dashboard with ChartJS

Final Product What You’ll Be Creating DownloadSOURCE FILES DemoVIEW IT ONLINE Today we will be creating a dynamic dashboard with live charts, through the power of ChartJS. ChartJS is a powerful, dependency free JavaScript library which builds graphs via the canvas element. Best of all, it’s easy for designers to get up and running. We’ll be focusing… Continue reading Build a Dynamic Dashboard with ChartJS
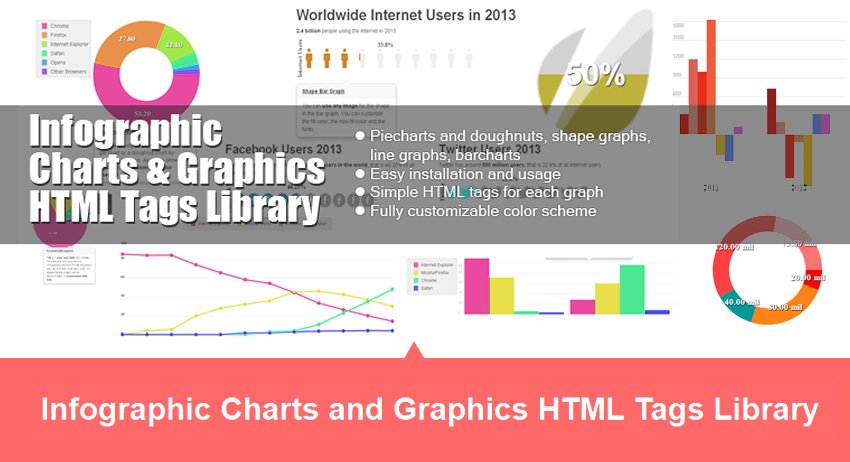
Ultimate Collection of Free Vector Elements For Infographics Design
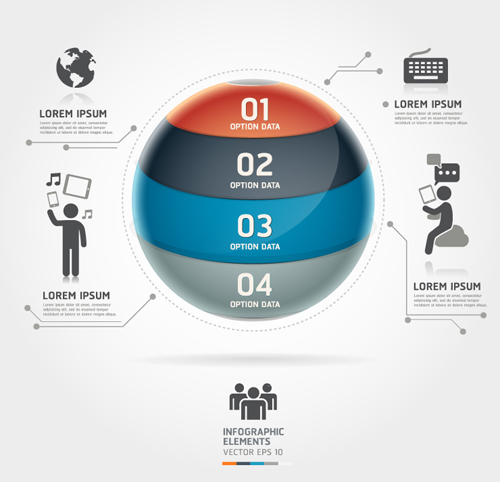
This is the big list of Vector Elements which are great for infographics designing. Info-graphics are graphic visualization and representations of data and information. Designers using graphic elements to explain complex information, numbers or data in quick and effective manner. It is usually used in statistics, business plans, feasibility studies, web analytic and more. Infographics includes different visual elements,… Continue reading Ultimate Collection of Free Vector Elements For Infographics Design
Make Pretty Charts For Your App with jQuery and xCharts
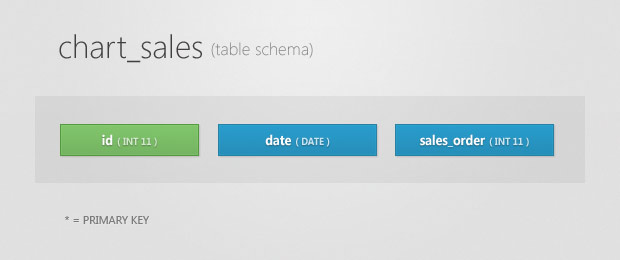
Charts are a great visual aid when presenting data. You can’t build a professional admin panel without them. They are also tricky to set up. However, there is a new library that makes things easier – xCharts. Today, we are going to use it along with the daterange picker for Twitter Bootstrap, to build a… Continue reading Make Pretty Charts For Your App with jQuery and xCharts