In this tutorial, you will have the opportunity to learn how to draw a set of elements for a medical infographic template in Illustrator!
If you’d like to skip this tutorial and just use this infographic design template (with even more elements!) in your work, you can go ahead and simply purchase Big Set of Flat Medical Infographic Elements from GraphicRiver!

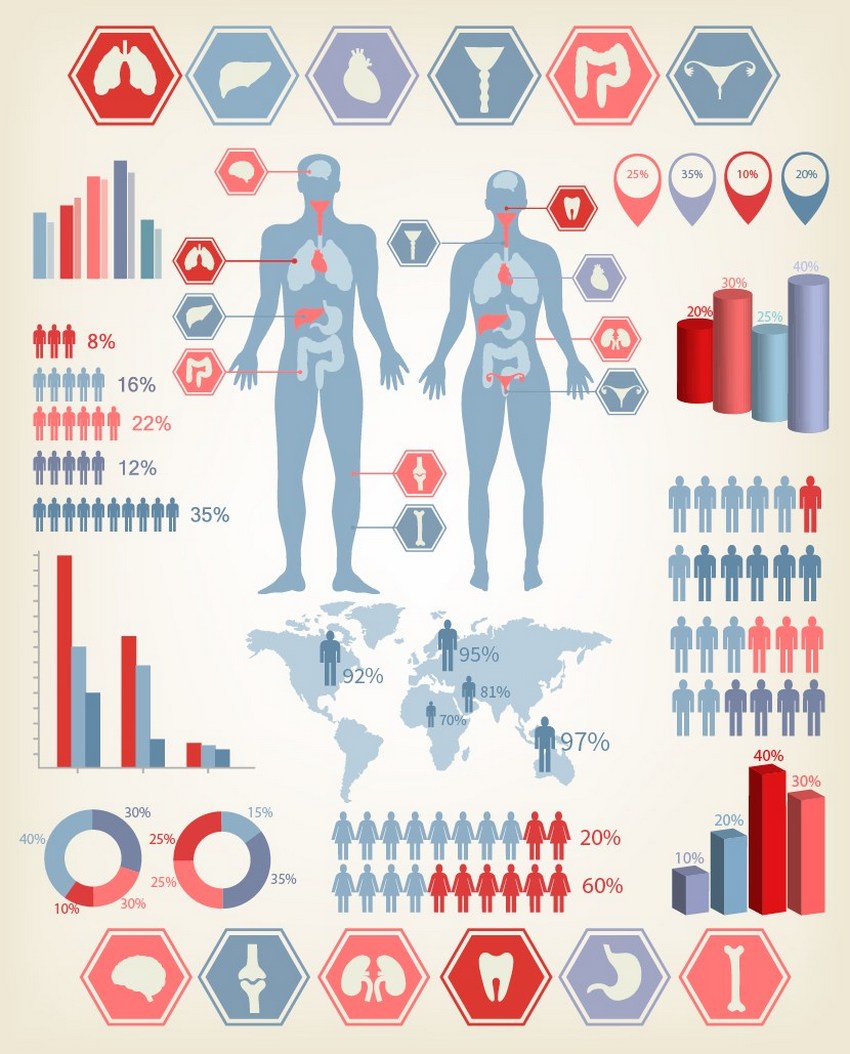
1. How to Draw the Bodies and Organs
Step 1
Let’s begin by drawing our first set of elements for the research infographic template!
To draw the outline of the male body, copy the half illustrated on the left, and then Reflect it and merge both copies with the Outline function in the Pathfinder panel.

Step 2
Do the same for the female body!

Step 3
Fill both body outlines with #98AEC5.

Step 4
Draw lungs, using the same Pathfinder function. Fill the organ in with #C7D7E2.
Next, make a copy of the lungs and place them inside a #BF3B35 hexagon icon with an outline of the same color. Color the lungs with #EDEDDD.
Add a line with a small circle on the end of it to serve as a pointer.

Step 5
Repeat a similar process for the liver, only changing the hexagon’s color to #889CB1.

Step 6
Use #ED7777 for the brain icon.

Step 7
Draw the next set of organs, using the same colors and functions as before.

Step 8
Draw the next organ, coloring it with #EDEDDD.

Step 9
Add the heart. Use #A1A4C2 for the icon.

Step 10
Draw the rest of the organs, using the same colors as we did earlier in the tutorial.

Step 11
Place the organs and the icons as shown below.

2. How to Create the Graphs
Step 1
Draw the axis for the graph, and then add columns using these colors:
You can use a Rectangular Grid with 13 Horizontal Dividers for reference.

Step 2
Create one more graph with different-colored columns.

Step 3
Create a stick man out of different shapes, using the Pathfinder functions Minus Front and Unite to make the figure.
Use #98AEC5 for the blue stick man and #BF3B35 for the red one.

Step 4
Create three more copies of the figure, coloring them with #ED7777, #7B83A1, and #6F89A4.
Make some graphs as seen below, indicating the percentages with the number of the stick men used.

Step 5
Proceed similarly to build a stick woman, coloring it with the same colors.

Step 6
Use it to complete a few simple graphs.

Step 7
I’ve used an open source vector map for our research infographic template.
You can use the same one or add your own.
Color your world map with #BFCEDB and add a #6F89A4 stick man.

Step 8
Place the figures with the percentages onto the map.

Step 9
Create four colored percentage bars as pictured below.
Use these colors:
#A1A4C2#98AEC5#C23F40-
#ED7777

Step 10
Make all of the columns 3D by going to Effect > 3D > Extrude and Bevel.
Use the settings below for all of the columns.

Step 11
Expand Appearance of the columns and add the percentages, using the same color.

Step 12
Add one more 3D bar graph, this time using Effect > 3D > Revolve and these colors:
#DD1E20#FF7D7D#C5E6FF-
#CCD3FF

Step 13
Expand Appearance of the graphs and arrange them in a slanted line.

Step 14
Draw colored markers, using the Pathfinder functions Unite and Minus Front.
Color them with #ED7777, #A1A4C2, #C23F40, and #6F89A4.

3. How to Draw the Circular Graph
Step 1
Cut out the middle of a circle with the Minus Front function in Pathfinder.

Step 2
Add a Polar Grid with 20 Radial Dividers and overlay it on top of the graph.

Step 3
Use the dividers as references to measure out the percentages seen below, and then use the Divide function to “cut up” the circular graph.
Use these colors:
#98AEC5#7B83A1#ED7777#C03F40

Step 4
Draw the background with Gradient Mesh.
Begin with a #F5F2E6 rectangle, and then, with the Mesh Tool (U), create a mesh grid as pictured below.
Color the middle node with #FFFFFF, and then add two nodes colored with #F6F4EB above and below it.
Change the edges to #EEEAD9.

Step 5
Place the infographic elements we made onto the background.

Awesome Work, Your Infographic Design Template Is Now Done!
You’ve completed the research infographic template in Illustrator! What now? You can try any of my other tutorials from my profile, or check out my portfolio on GraphicRiver, as well as my collection of medical infographic elements, some of which we’ve used in this tutorial.
I hope you enjoyed the tutorial, and I would be super happy to see any results in the comments below!
Check out more of my tutorials: