In previous tutorials we’ve learned how to create different types of charts including bar charts, thermometer charts, and donut charts. Today we’ll continue this journey by building a CSS-only organizational chart.
Ready to test your CSS skills?
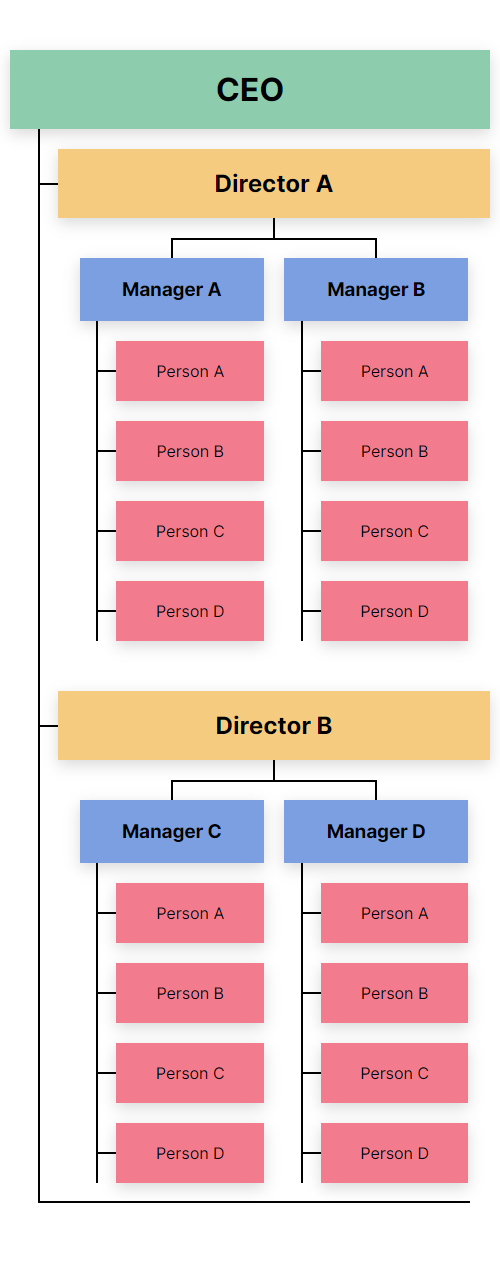
The Organizational Chart We’re Building
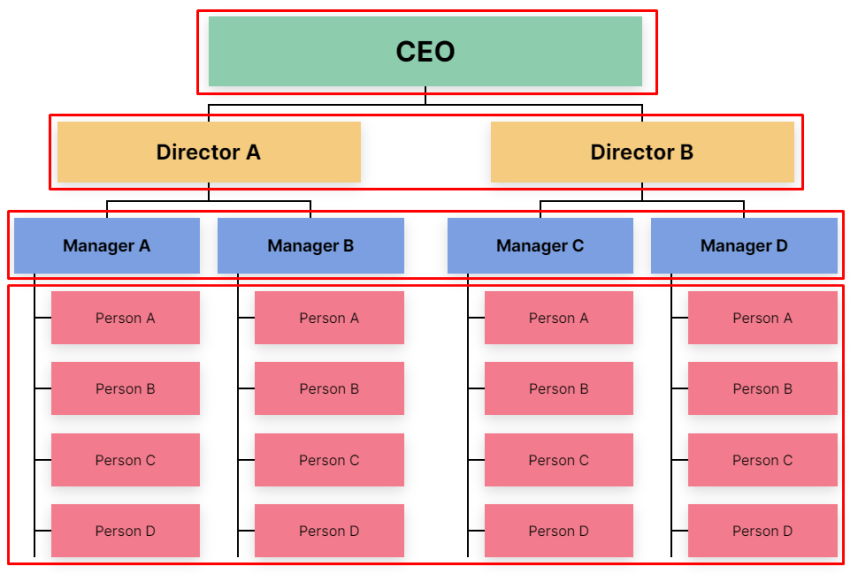
Here’s the CSS chart we’ll be creating:
It consists of four levels and describes the hierarchical structure of a company.
What is an Organizational Chart?
To find out what an organizational chart is, let’s borrow Wikipedia’s definition:
“An organizational chart , also called organigram or organogram, is a diagram that shows the structure of an organization and the relationships and relative ranks of its parts and positions/jobs. The term is also used for similar diagrams, for example ones showing the different elements of a field of knowledge or a group of languages.”
Here’s an example:
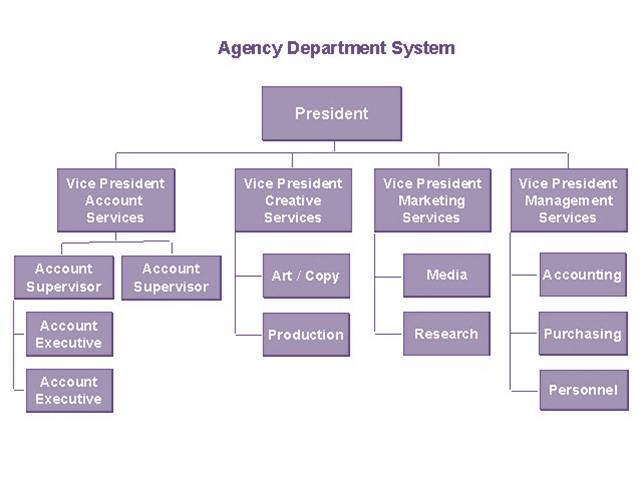
This type of chart is commonly used for presenting the relationships between the people or departments of a company. On a corporate website, you will probably find it on the “About Us” or “Company” page.
You’ll also see organizational charts used for family trees (check out the British Royal Family tree and line of succession on the BBC’s website). They’re ideally suited for illustrating hierarchy.
1. Specify the Container
Our chart will live inside a container:
<div class="container">
  <!-- Chart goes here -->
</div>
2. Define Some Basic Styles
Before going through its levels, we’ll set up a few reset rules and helper classes:
:root {
  --level-1: #8dccad;
  --level-2: #f5cc7f;
  --level-3: #7b9fe0;
  --level-4: #f27c8d;
  --black: black;
}

* {
  padding: 0;
  margin: 0;
  box-sizing: border-box;
}

ol {
  list-style: none;
}

body {
  margin: 50px 0 100px;
  text-align: center;
  font-family: "Inter", sans-serif;
}

.container {
  max-width: 1000px;
  padding: 0 10px;
  margin: 0 auto;
}

.rectangle {
  position: relative;
  padding: 20px;
  box-shadow: 0 5px 15px rgba(0, 0, 0, 0.15);
}
Notice the rectangle class. We’ll append this to every node/element of our chart.
Note: For simplicity, I haven’t optimized the CSS. This will help you get a better understanding of the styles of each level.
3. Specify the Levels
At this point, we’re ready to specify the chart levels; as we discussed earlier, here we’ll have four of them:
Each level will represent a role in a company starting from the highest-ranking one.
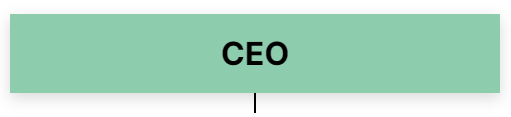
Level #1
The first level will only include a single node:
HTML
To describe it, we’ll use an h1 tag as it’s the most important part of our chart:
<h1 class="level-1 rectangle">...</h1>
CSS
We’ll use its ::before pseudo-element to create a relationship between the first and second levels:
/*CUSTOM VARIABLES HERE*/

.level-1 {
  width: 50%;
  margin: 0 auto 40px;
  background: var(--level-1);
}

.level-1::before {
  content: "";
  position: absolute;
  top: 100%;
  left: 50%;
  transform: translateX(-50%);
  width: 2px;
  height: 20px;
  background: var(--black);
}
Level #2
The second level will consist of two nodes:
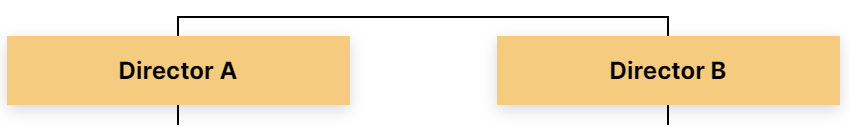
As we’ll see in a moment, each node will include other child nodes.
These child nodes will represent lower levels of the managerial hierarchy.
HTML
To describe it, we’ll use an ordered list with two list items. Each list item will contain an h2 element:
<ol class="level-2-wrapper">
  <li>
    <h2 class="level-2 rectangle">...</h2>
  </li>
  <li>
    <h2 class="level-2 rectangle">...</h2>
  </li>
</ol>
CSS
Thanks to CSS Grid, we’ll create the layout for this level.
Next, we’ll use the ::before pseudo-element of specific elements for creating the associations between the nodes of this level and the adjacent levels:
/*CUSTOM VARIABLES HERE*/

.level-2-wrapper {
  position: relative;
  display: grid;
  grid-template-columns: repeat(2, 1fr);
}

.level-2-wrapper::before {
  content: "";
  position: absolute;
  top: -20px;
  left: 25%;
  width: 50%;
  height: 2px;
  background: var(--black);
}

.level-2-wrapper::after {
  display: none;
  content: "";
  position: absolute;
  left: -20px;
  bottom: -20px;
  width: calc(100% + 20px);
  height: 2px;
  background: var(--black);
}

.level-2-wrapper li {
  position: relative;
}

.level-2-wrapper > li::before {
  content: "";
  position: absolute;
  bottom: 100%;
  left: 50%;
  transform: translateX(-50%);
  width: 2px;
  height: 20px;
  background: var(--black);
}

.level-2 {
  width: 70%;
  margin: 0 auto 40px;
  background: var(--level-2);
}

.level-2::before {
  content: "";
  position: absolute;
  top: 100%;
  left: 50%;
  transform: translateX(-50%);
  width: 2px;
  height: 20px;
  background: var(--black);
}

.level-2::after {
  display: none;
  content: "";
  position: absolute;
  top: 50%;
  left: 0%;
  transform: translate(-100%, -50%);
  width: 20px;
  height: 2px;
  background: var(--black);
}
Notice that we also define the ::after pseudo-element of the second-level nodes. This will appear only on small screens.
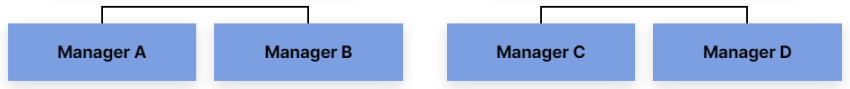
Level #3
The third level will include four nodes.
We’ll associate the first two nodes with the first node of the second level, while the last two with its second node:
HTML
Still, inside the initial list where the second level lives, we’ll define two new lists. Each one of them will contain two list items. For each item will specify an h3 element:
<ol class="level-2-wrapper">
  <li>
    ...
    <ol class="level-3-wrapper">
      <li>
        <h3 class="level-3 rectangle">...</h3>
      </li>
      <li>
        <h3 class="level-3 rectangle">...</h3>
      </li>
    </ol>
  </li>
  <li>
    ...
    <ol class="level-3-wrapper">
      <li>
        <h3 class="level-3 rectangle">...</h3>
      </li>
      <li>
        <h3 class="level-3 rectangle">...</h3>
      </li>
    </ol>
  </li>
</ol>
CSS
Thanks again to CSS Grid, we’ll position the nodes.
In the same way, we’ll set the ::before pseudo-element of specific elements for creating the required connections:
/*CUSTOM VARIABLES HERE*/

.level-3-wrapper {
  position: relative;
  display: grid;
  grid-template-columns: repeat(2, 1fr);
  grid-column-gap: 20px;
  width: 90%;
  margin: 0 auto;
}

.level-3-wrapper::before {
  content: "";
  position: absolute;
  top: -20px;
  left: calc(25% - 5px);
  width: calc(50% + 10px);
  height: 2px;
  background: var(--black);
}

.level-3-wrapper > li::before {
  content: "";
  position: absolute;
  top: 0;
  left: 50%;
  transform: translate(-50%, -100%);
  width: 2px;
  height: 20px;
  background: var(--black);
}

.level-3 {
  margin-bottom: 20px;
  background: var(--level-3);
}
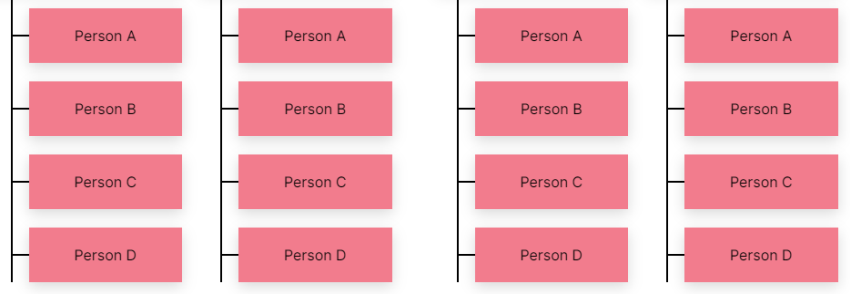
Level #4
We’ll need sixteen nodes for the fourth level. These will equally be distributed into four lists.
Each third-level node will include one list:
HTML
Still, inside the initial list where the second level lives, we’ll define four new lists. Each one of them will contain four list items. For each item will specify an h4 element:
<ol class="level-2-wrapper">
  <li>
    ...
    <ol class="level-3-wrapper">
      <li>
        ...
        <ol class="level-4-wrapper">
          <li>
            <h4 class="level-4 rectangle">...</h4>
          </li>
          ...
        </ol>
      </li>
      <li>
        ...
        <ol class="level-4-wrapper">
          <li>
            <h4 class="level-4 rectangle">...</h4>
          </li>
          ...
        </ol>
      </li>
    </ol>
  </li>
</ol>
CSS
Once more, we’ll set out the ::before pseudo-element of specific elements for associating the fourth-level nodes with their parents:
/*CUSTOM VARIABLES HERE*/

.level-4-wrapper {
  position: relative;
  width: 80%;
  margin-left: auto;
}

.level-4-wrapper::before {
  content: "";
  position: absolute;
  top: -20px;
  left: -20px;
  width: 2px;
  height: calc(100% + 20px);
  background: var(--black);
}

.level-4-wrapper li + li {
  margin-top: 20px;
}

.level-4 {
  font-weight: normal;
  background: var(--level-4);
}

.level-4::before {
  content: "";
  position: absolute;
  top: 50%;
  left: 0%;
  transform: translate(-100%, -50%);
  width: 20px;
  height: 2px;
  background: var(--black);
}
Organizational Charts and Going Responsive
Making an organizational chart responsive is tricky. I remember myself having to reconstruct the markup one or two times until coming up with this version. So, if you plan to create such a chart, I recommend you follow a mobile-first approach.
With all this in mind, here’s its mobile layout:
To accomplish this behavior, we have to modify some styles:
@media screen and (max-width: 700px) {
  .rectangle {
    padding: 20px 10px;
  }

  .level-1,
  .level-2 {
    width: 100%;
  }

  .level-1 {
    margin-bottom: 20px;
  }

  .level-1::before,
  .level-2-wrapper > li::before {
    display: none;
  }

  .level-2-wrapper,
  .level-2-wrapper::after,
  .level-2::after {
    display: block;
  }

  .level-2-wrapper {
    width: 90%;
    margin-left: 10%;
  }

  .level-2-wrapper::before {
    left: -20px;
    width: 2px;
    height: calc(100% + 40px);
  }

  .level-2-wrapper > li:not(:first-child) {
    margin-top: 50px;
  }
}
We’ve Finished Our CSS Chart!
Congrats, folks! Without writing a single line of JavaScript, we managed to build a fully functional organizational chart.
Let’s remind ourselves of what we built:
Of course, keep in mind that our chart has a specific structure. Depending on your needs, you might want to enrich its content or modify its layout. If you need something more advanced or dynamic, have a look at some JavaScript libraries like Highcharts.js.
Have you ever created a CSS chart? If so, please share your experience with us!
More CSS Charts (Sometimes With JavaScript)
If you still need some inspiration, don’t forget to check at my other charts in the Tuts+ archive or do a quick search on CodePen.
As always, thanks a lot for reading!
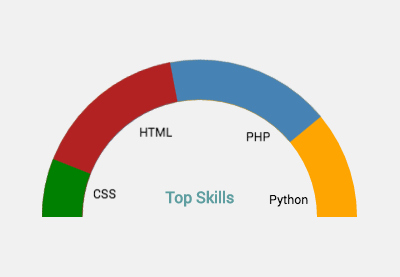
 CSSHow to Build a Semi-Circle Donut Chart With CSS
-
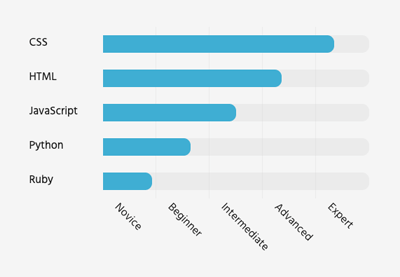
CSSHow to Build a Static Portfolio Page With CSS & JavaScript
-
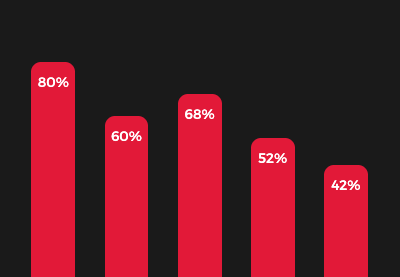
CSSBuild a Static Portfolio With Advanced CSS Bar Chart
-
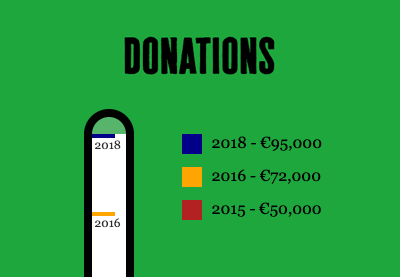
CSSHow to Build an Animated CSS Thermometer Chart
-
CSS ChartsHow to Build a Simple Gantt Chart With CSS and JavaScript