
User Behaviour
Whatever someone does while on your website is called user behaviour. It includes the journey within your website’s pages, interaction with page elements, page scroll, form submissions, link/button clicks, and others.
Analytics will help you understand the user behavior of your website better. How far are they scrolling down the page? Which forms are being used consistently? Are there any pages people simply don’t go to? Optimizing your website after analyzing the behavior will definitely help you improve the engagement/conversion on your website.
User journey and returning users:
A visitor landing on a page and visiting a different parts of your website is called the user journey. User journeys help you discover which pages are making people abandon your website, and which pages keep them engaged.
In most cases, you will have a common user journey to the core product/services page of your website. That user journey is important for you. It will allow you to explore the drop-offs, bounce ratio, and exit pages on this user journey, and thus be able to improve the engagement.
On Google Analytics, you will find the ‘User Journey’ under ‘User Behavior Report’. If you see a high bounce rate on your product/services page you need to re-think the page design and content. But if you see a very few visitors reaching those pages, you have some issue with prior pages.
Acquiring new visitors and converting them into customers is cool, but converting returning/repeating users is much easier than you think.
Returning users are deeper inside your sales funnel as they are familiar with your website, content, and product/services. New visitors are just getting started with your website.
Lower returning visitor session suggest an issue with your website’s UX. Fixing the high traffic (most visited) page with high bounce rate would probably show significant changes to your website’s traffic.
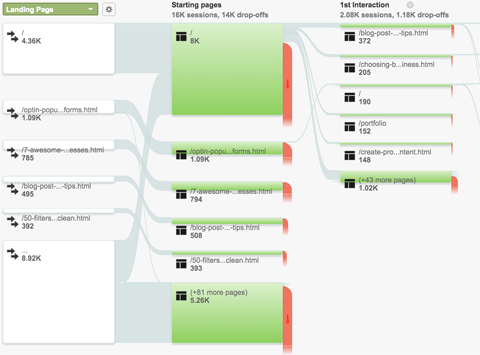
Image source: Social Media Examiner
New vs Returning:
It’s always good to convert a new visitor into a customer. But converting a returning visitor into a customer is far easy than converting a new visitor.
Check your returning user analysis.
Time analysis:
Time is another important factor in user engagement. How much time they spend on your website and pages matters.
Sometimes a user spending more time on a page is a positive sign and sometimes it is a negative sign. How would you differentiate? And what action should you perform?
The positive one: If you observe users spending more time on a page which has a lengthy but well researched content. It is a positive sign. You should consider it as an engagement. This generally happens with blog posts.
The negative one: If you observe users spending more time on a page which has very little content, it’s a negative sign. The chances are your users are confused, don’t have clue about where to go next, and didn’t find the information they were looking. If you see this happening with your product/services page, you need to take action.
What actions should you perform?
Make sure all your links and buttons are working fine.
Also, make sure the page with the high drop off rate has uniform UI design with correct a call to action elements in place.
Ensure your above the fold section has meaningful, action motivating, and engaging content. For the product page, throw your product images, specs, and price above the fold.
Use heat maps on your analytics service (Google analytics, Hotjar, and Crazy Egg offer heat map analysis) to make sure visitors are viewing the full page and making relevant actions.
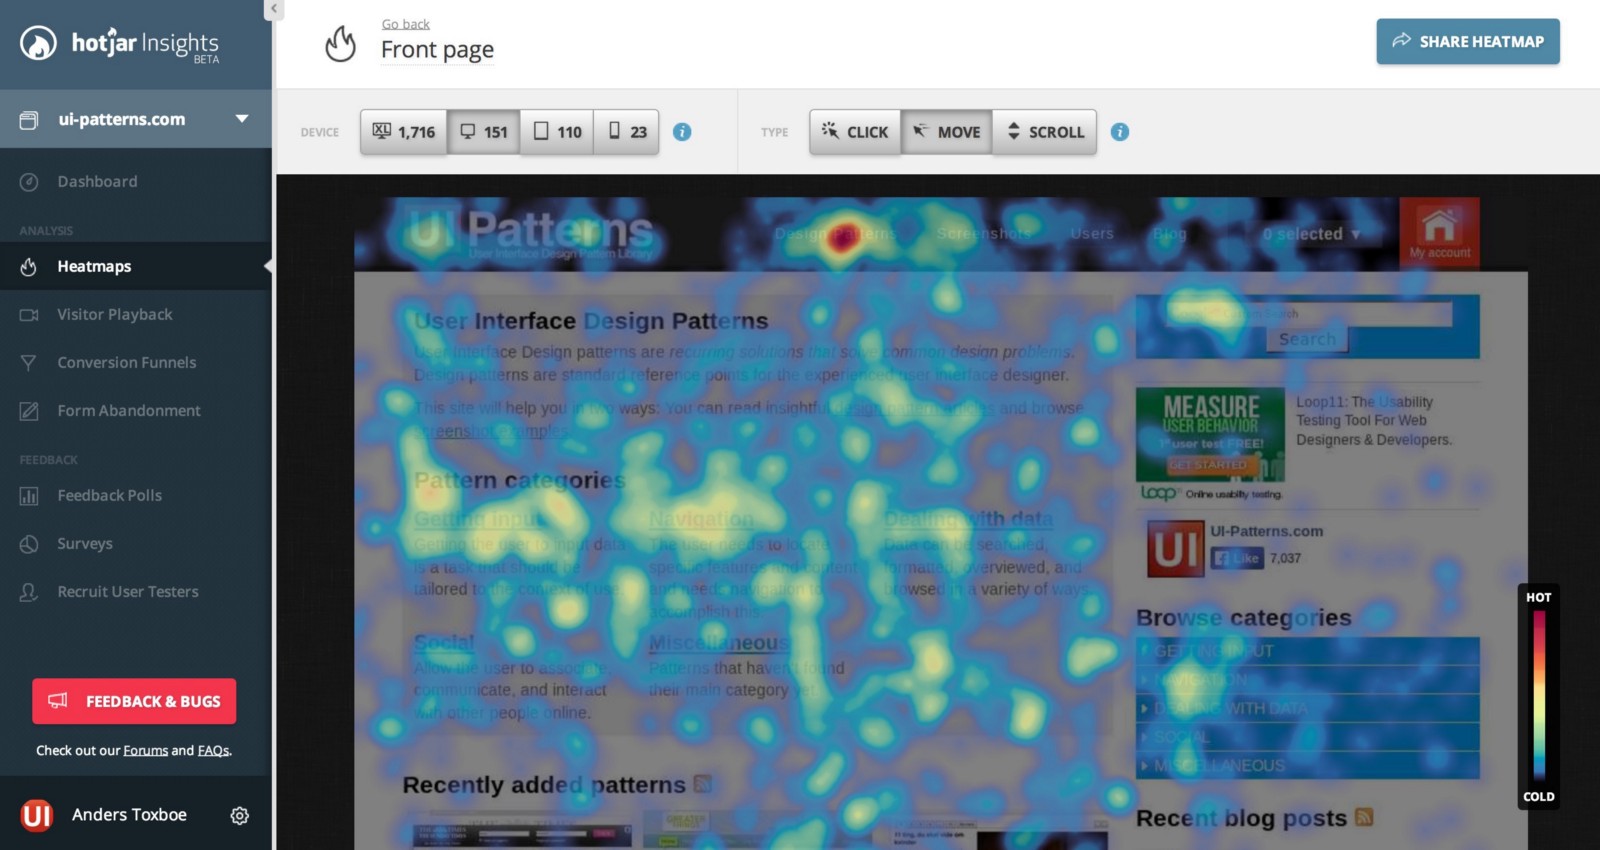
An example of a Hotjar heat map via https://www.bka.co.nz. Red areas represent more clicks and blue represents less.
If the users are making a full page journey quickly, there might be something like important information, content, images, or a guided action element missing on your page.
If users are not making a full page journey, there is something wrong with your above the fold content. Check their interaction, time spent on page, and content you have above the fold. Change it and put under A/B test to measure the results.
User behavior, a recap:
- Common user journey
- Next and previous page visit flow
- Are they scrolling to the end?
- How they interact with page
- Time analysis: how quickly they find items, how long do they take to perform an action, loading time, how they behave with interactions you have on a page