Summary:
A/B tests incrementally improve the user experience of a product while effectively reaching business goals.
A/B testing (sometimes also referred to as split testing) is a popular UX research method, with widespread adoption across businesses and industries. To ensure reliable, meaningful, and beneficial results for your organization, follow best practices and avoid common mistakes when planning and setting up an A/B test.
What Is A/B Testing?
A/B testing is a quantitative research method that tests two or more design variations with a live audience to determine which variation performs best according to a predetermined set of business-success metrics.
In an A/B test, you create two or more variations of a design in a live product. Most commonly, you’ll compare the original design A, also called the control version, and one variation B, called the variant. Ideally, the variant should differ from the original design only in one design element alone, such as a button, an image, or a description.
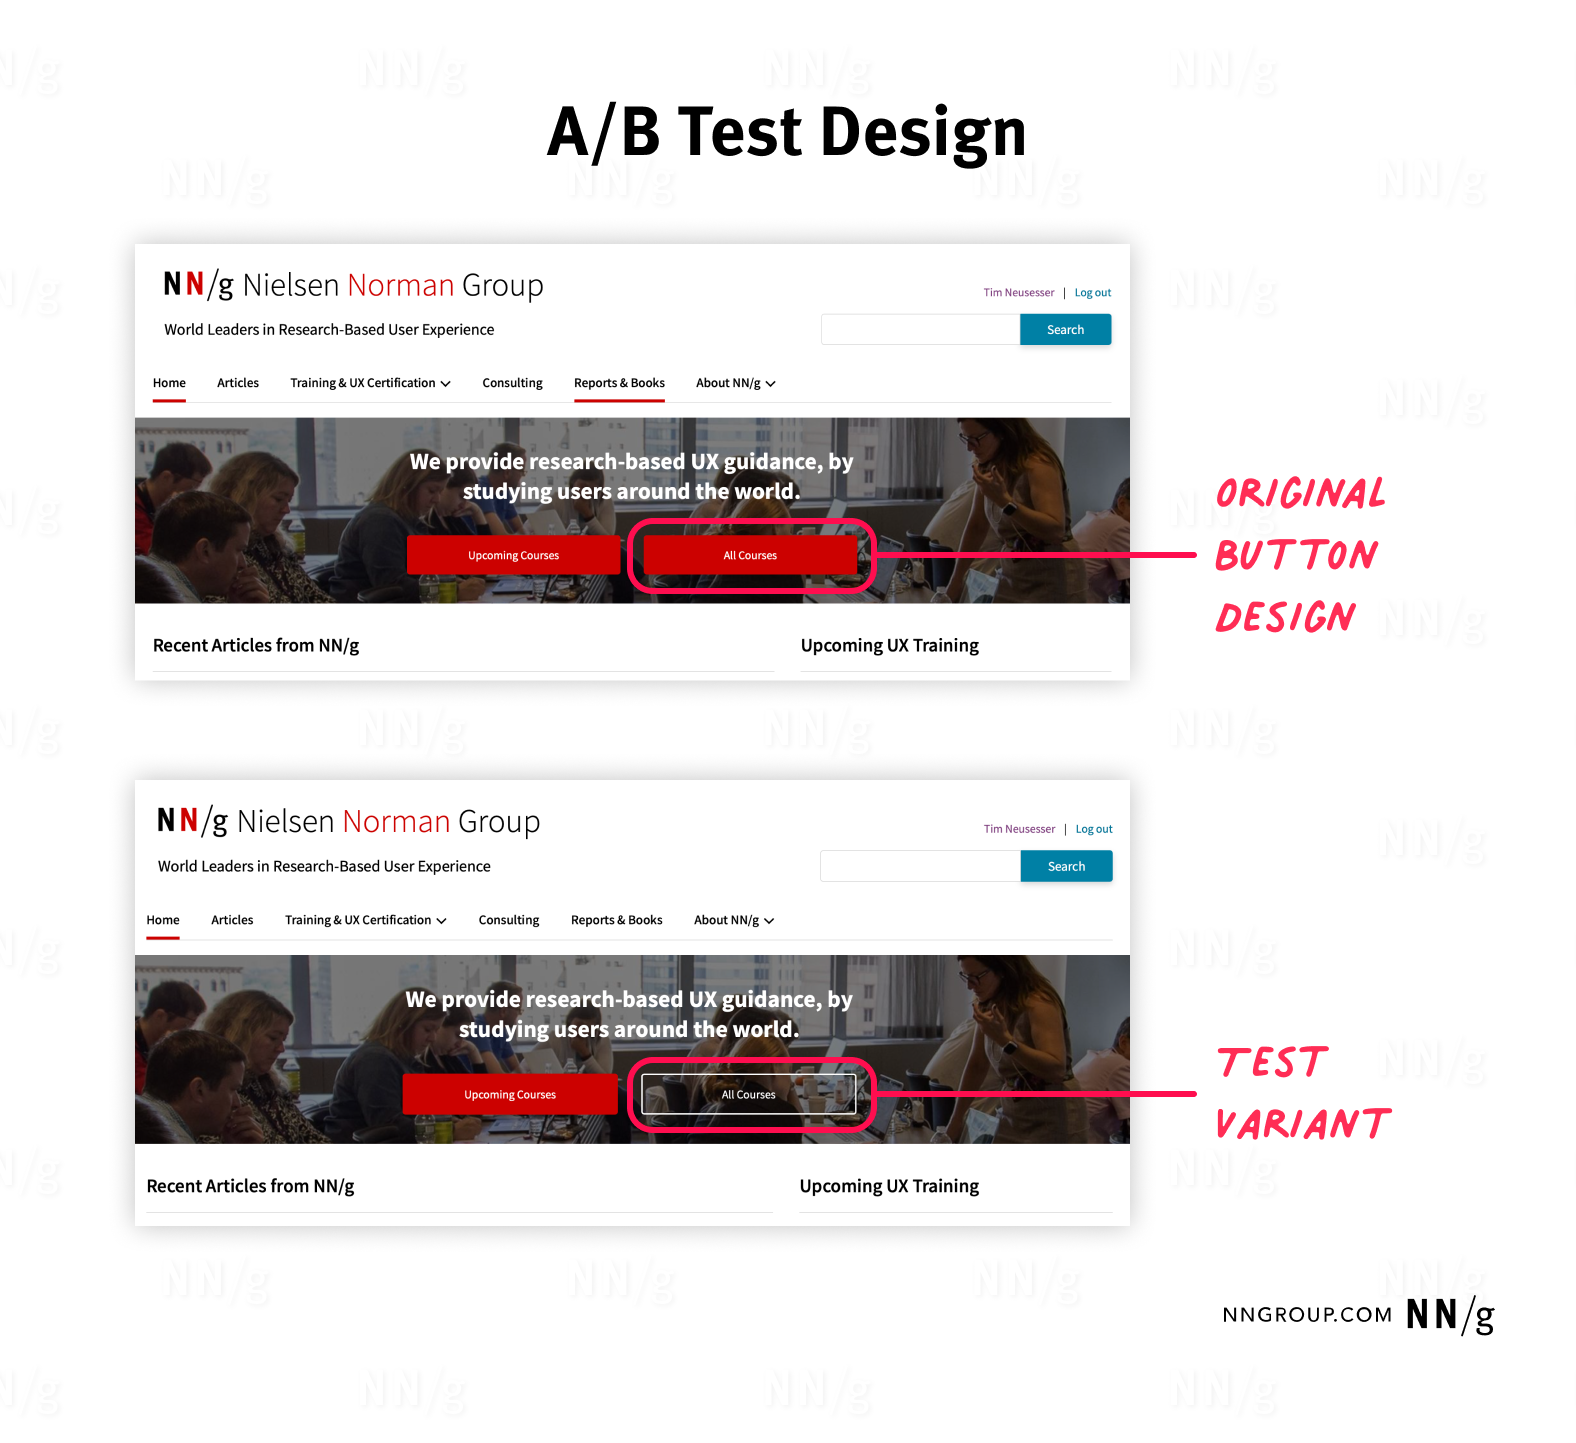
During the A/B test, the incoming traffic of real users to your product is split, so that each visitor will be directed to only one of your design variations. This split of traffic can be such that each variation receives the same share of traffic, or it can be adjusted based on business objectives and risk. (For example, if testing a design variation on half of your site’s traffic would bear too much risk.)
Once the traffic is split to your design variations, you collect a set of metrics to determine which design variation encourages desired user behaviors and thereby better supports your business objectives.
In many cases (but not all), if the variant statistically significantly outperforms the original design, it should be used as the new design of the product. If the test was inconclusive or if your original design outperformed the variation, you should keep the original design. In this case, consider whether testing another design variation might yield better results.
Why Conduct an A/B Test?
A/B testing can help UX teams determine the improvements in the user experience that are best for their business goals. Additionally, it enables them to make data-driven design decisions, which can result in a high return on investment and tend to be easier to communicate to stakeholders than insights from qualitative studies.
A/B testing is also an efficient method for continuous design improvements, as you can incrementally improve the usability and effectiveness of your product without extensive overhauls.
Common Use Cases
A/B testing requires unambiguous metrics that clearly showcase whether a design variation outperforms the original design. These metrics often focus on monetary aspects, such as revenue or costs. Metrics commonly used in A/B testing include conversion rate, click-through rate, bounce rate, retention rate, and revenue per user.
Industries and products where A/B testing is frequently used and where it can have a significant impact and a high return on investment include:
- Ecommerce (e.g., Amazon)
- Entertainment products (e.g., Netflix, Spotify)
- Social media (e.g., Facebook, Instagram, TikTok)
- Software as a service (e.g., Salesforce, Office365)
- Online publishing (e.g., The New York Times)
- Email marketing
Design elements these industries most commonly test include:
4 Steps for Setting Up an A/B Test
Following the 4 steps outlined below will increase the likelihood of conducting a test that is reliable, meaningful, and that yields a positive result.
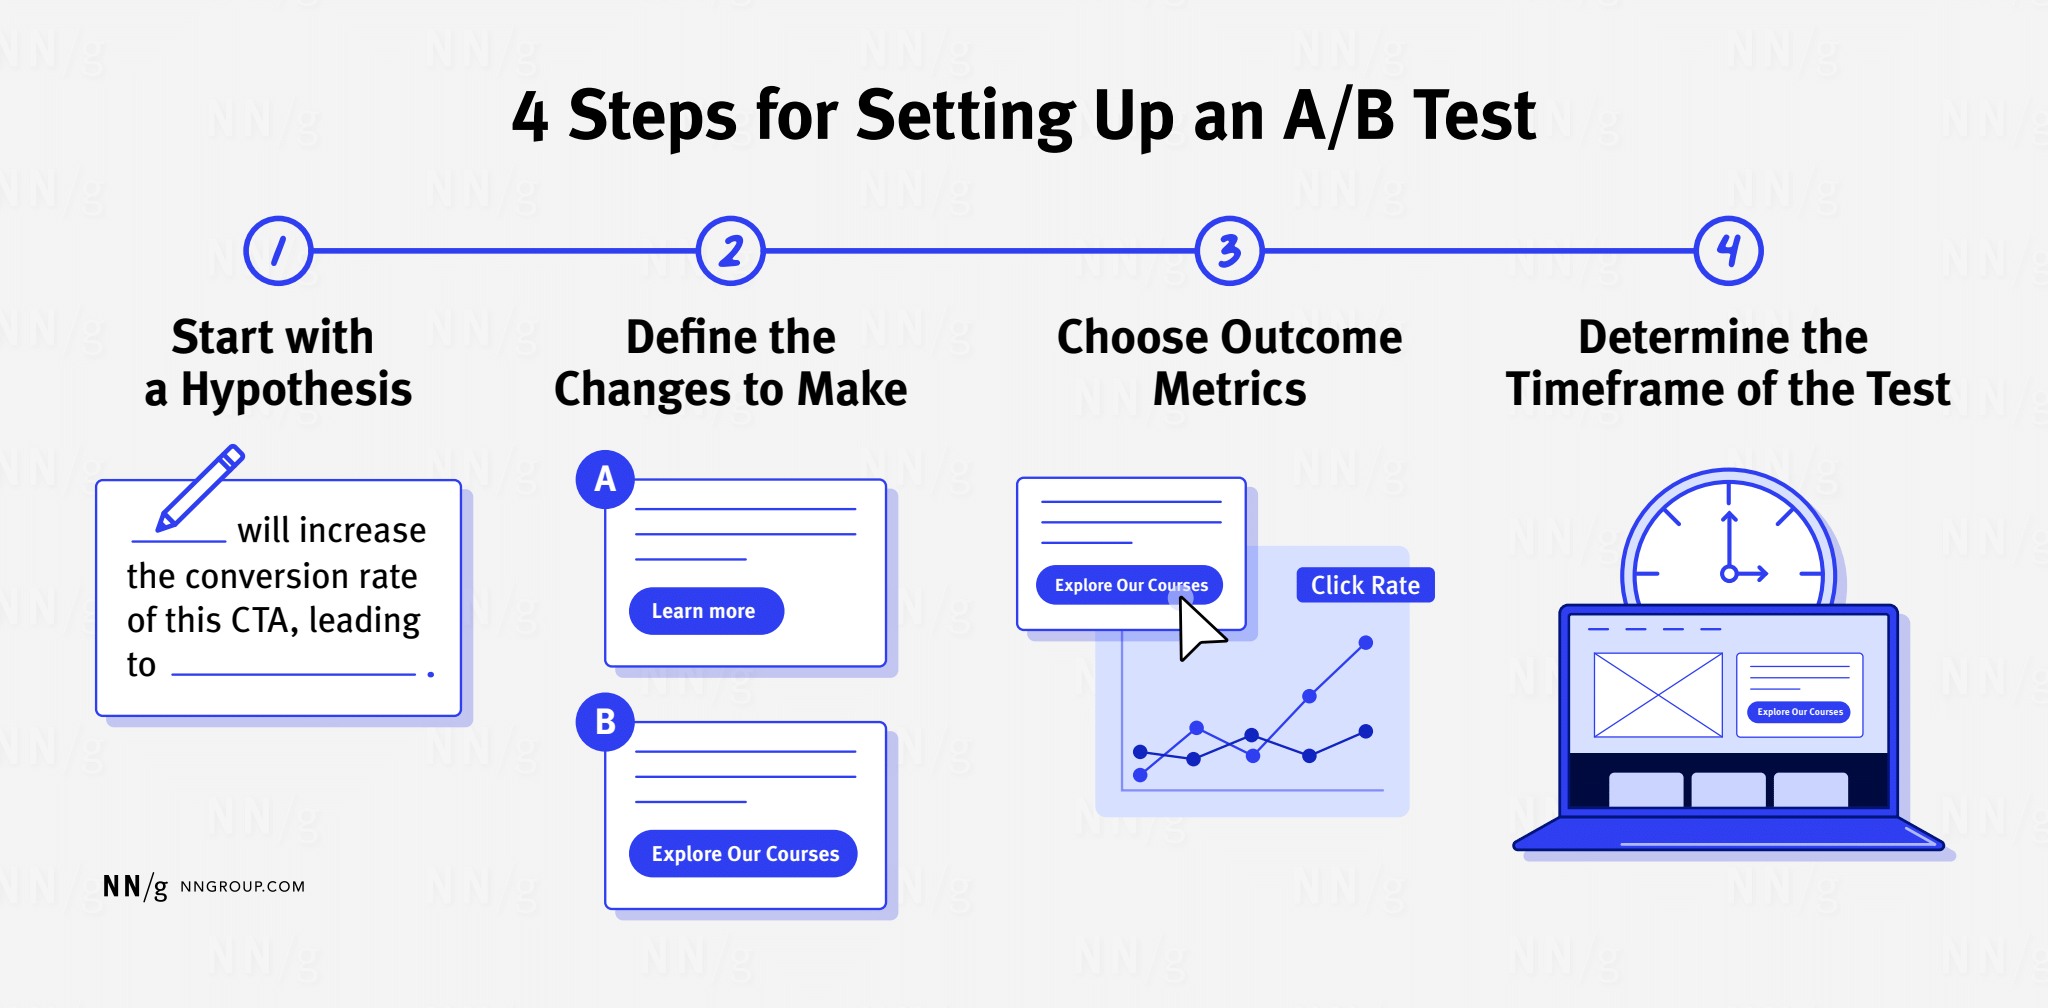
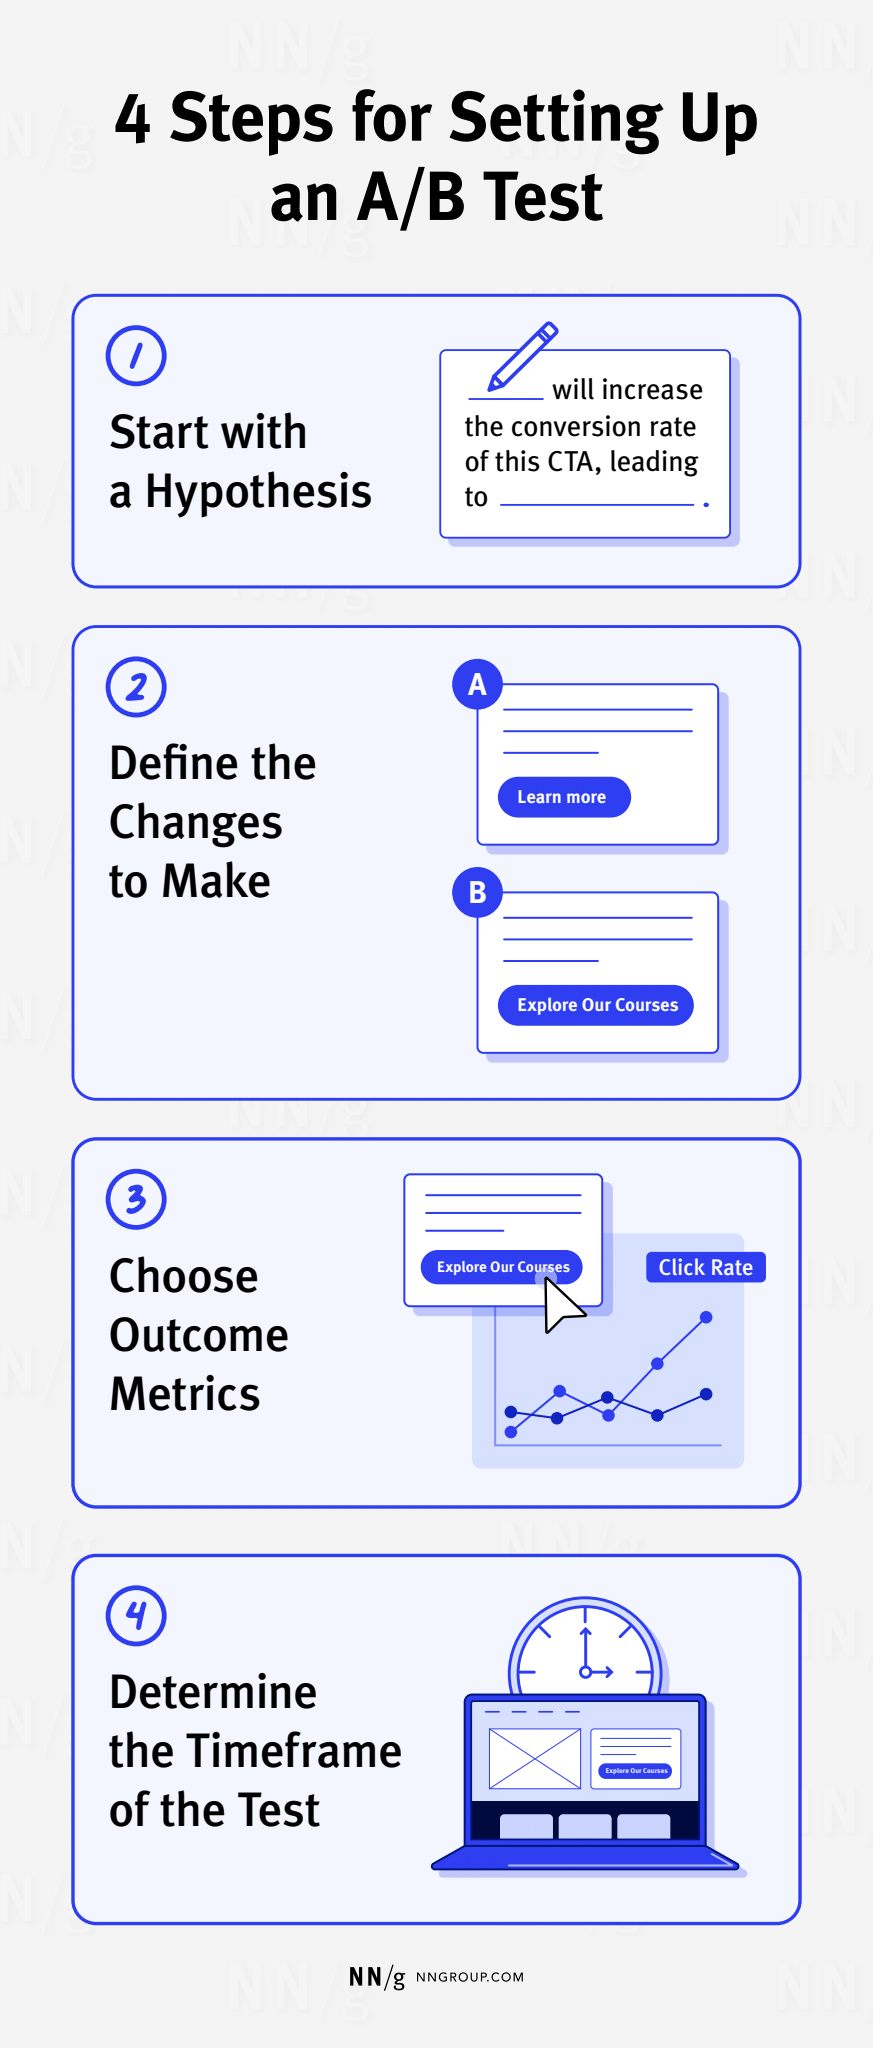
1. Start with a Hypothesis
Before getting started on an A/B test, you should come up with a hypothesis for which changes might have which impact. As stated above, the more this hypothesis is based on user research and business insights, the higher the likelihood that your A/B test will be successful and meaningful. Your hypothesis should be directly connected to a clearly defined goal that you want to accomplish with your A/B test.
Example: You run an ecommerce site. You observed in qualitative usability tests that multiple participants disregarded a call-to-action (CTA) button with the label Purchase. Your hypothesis is that a design change of this page will increase the conversion rate of this CTA, eventually leading to higher sales.
2. Define the Changes to Make
Once you have a strong hypothesis, you must decide which changes to make to which design element to test your hypothesis. These changes should address just one design element and not be an extensive design overhaul. Again, the more this decision is based on insights from user research, the higher the chances that your test will be successful, as these insights will positively impact your ideation process.
Example: Based on your insights from qualitative usability testing, you decide to change the label of the CTA button. During the tests, you observed that participants noticed the button but were unsure about its message. So, you keep the button’s visual design but change the label to Buy Now.
3. Choose Outcome Metrics
Clearly define which metrics you want to track to determine the impact and success of your A/B test. You should define primary metrics, which will tell you if the design variation results in the hoped-for change in behavior. Additionally, you should define and track guardrail metrics, to determine if the change in user behavior truly has a positive impact on the business.
Example: To understand if changing your CTA label to Buy Now results in an increase of sales, you decide to track the CTA’s click rate. Additionally, you will also track the purchase rate and the average sale amount per purchase. These guardrail metrics help you determine whether a higher click rate of your design variation will have a positive business impact.
4. Determine the Timeframe of the Test
Once you have a strong hypothesis and define the changes to make and metrics to track, you must decide for how long to run your A/B test. This parameter depends on the required sample size for your test.
To determine the required sample size for your test, you must define three numbers:
- Baseline outcome-metric value: The outcome metric (e.g., conversion rate, click rate) for your design
- Minimum detectable effect: The minimum relative change in the outcome metric that you want to be able to detect
- Statistical-significance threshold (usually 95%): The degree of certainty you want to have that your test result is reliable
Once you define these three metrics, you can use a sample-size calculator to determine the required sample size for your A/B test. Even with sufficient traffic, we recommend to run your A/B test for at least 1-2 weeks to account for potential fluctuations in user behavior.
Example: Using your analytics data, you determine that the baseline click rate of your Purchase CTA is 3%. You decide that your minimum detectable effect should be 20% (in other words, you want to be able to detect a change as small as 20% of the 3% baseline click rate, which amounts to a click rate of 3%+/- 0.6% for the variation) and your test should have a statistical significance of 95% (p=0.05). Using a sample-size calculator, you determine that your required sample size is 13,000 users. With an average of 1,000 daily users on your website, you decide to run your A/B test for 14 days, ensuring a large enough sample size and a long enough timeframe for potential fluctuations in user behavior.
Note that, to choose the minimum detectable effect, you should ask yourself which change in the outcome metric will amount to an effect that is practically significant for your business and worth the cost of the change. In our example, a change of 1% would mean being able to detect whether the click rate is just 0.03% bigger than the current one. To reach statistical significance for such a small difference a much larger sample size would be required, and the 0.03% change may have very little impact and may not be worth pursuing.
Choose Your A/B Testing Tool
If you’ve decided that you want to add A/B testing to your arsenal of research methods, you must choose which tool to use. There is a wide range of offerings, and the ideal tool will be highly contextual, varying based on your unique situation and needs. When selecting the right tool for your A/B testing efforts, consider the following factors:
- Budget: A/B testing tools can range from free to costing multiple thousand dollars per month.
- Complexity of your test(s): Consider how easy or complex the design variations you want to test are. Different tools allow for different levels of complexity, ranging from allowing only simple changes of color or copy to more complex changes to page layouts or allowing multivariate testing and split URL testing.
- Ease of use: Ensure that you and your team are comfortable enough with learning the new tool and that you have sufficient time to allocate to this task.
- Technical requirements: Ensure that the tool integrates seamlessly with your organization’s technical infrastructure and consider how much engineering time is required to create the test.
Once you select a tool that seems to fit your needs and requirements you should test the tool before running your first A/B test. The test will help you ensure that the A/B tool is set up correctly and works as intended. One common way to do so is an A/A test, where you create a variant that is exactly the same as your original design.
Testing two identical designs against each other should result in an inconclusive test result. If this is not the case, you can check what might have caused the differences in the test result. This approach helps minimize mistakes and implementation errors and ensures your A/B testing tool is set up correctly before you run the first A/B test.
Limitations and Common Mistakes in A/B Testing
Just as with any other research method, A/B testing has its limitations. It can provide great value in certain situations and when applied correctly, but it can also be a waste of resources and potentially harmful if applied incorrectly.
Limitations
A/B testing is not suited for:
- Low-traffic pages: To reach a point where an A/B test results in a statistically significant difference between two variations of a design, you often need thousands of users interacting with your product. This makes A/B testing a bad fit for pages with little traffic.
- Testing multiple changes at the same time: A/B testing should not be used to test design variations that change multiple design elements at the same time. While this is technically possible, you will lack an understanding of the impact of each individual change. To test multiple changes at a time, use multivariate testing instead, but be aware that these tests require even more data points to lead to reliable results.
- Understanding why user behavior changed: Similarly to other quantitative research methods, A/B testing is great at providing insights into how user behavior changes but will not provide any insights into why these changes occur. Thus, A/B testing provides the most benefit when it is combined with qualitative researchmethods. This practice is called triangulation.
Common Mistakes in A/B Testing
Disregarding the limitations of A/B testing and not following best practices can lead to misleading, potentially harmful outcomes. Some of the most common mistakes you should avoid are:
- Missing clearly defined goals: You must have clearly defined goals for the hoped-for outcome of an A/B test. These goals will align your team to understand why the test is conducted, provide guidance in creating design variations, and help build a roadmap for A/B testing based on the expected return on investment of each potential test you could run on your product.
- Stopping the test too early: A/B tests that lack sufficient data points will return unreliable results. Yet, some teams make the mistake of monitoring A/B tests in real time and drawing conclusions too early. To get statistically reliable results, you must wait until the appropriate sample size of a test is reached. Only then you should draw a conclusion and end your A/B test.
- Focusing on a single metric: The goal of an A/B rest is often to increase or decrease a certain metric. However, if you measure only one metric to determine whether your test is successful, you might disregard important information that can tell you if a design change is truly beneficial for your organization. For example, if you use a deceptive pattern in your design variation, you might positively impact one metric, such as a conversion rate, but might inadvertently negatively affect other metrics, such as retention rate. This is why you should track more than one metric, including guardrail metrics, which can give insight into the true impact of your design variation.
- Disregarding qualitative research and business context: Just because an A/B test yields a statistically significant result, it doesn’t mean that you should follow it blindly. After all, the A/B test might return a false positive or false negative, you might introduce a measurement error, or your result might be statistically significant but not practically significant. Thus, you must combine the results from your A/B test with your expert knowledge of your users and your organization to draw the right conclusions.