Skip to content

iDevie

Your Design Inspiration

  • Tutorials
    • Photoshop
    • Coding
    • WordPress
    • E-learning
    • Quick Tips
  • Design
    • Tools
    • Inspiration
    • User Experience (UX)
    • Interaction Design (IxD)
  • Dev
    • Front-End
    • Javascript
    • WordPress
    • Productivity
  • Freebies
    • Templates
    • Premium
    • UI / UI Kits
    • Resources
  • Contact

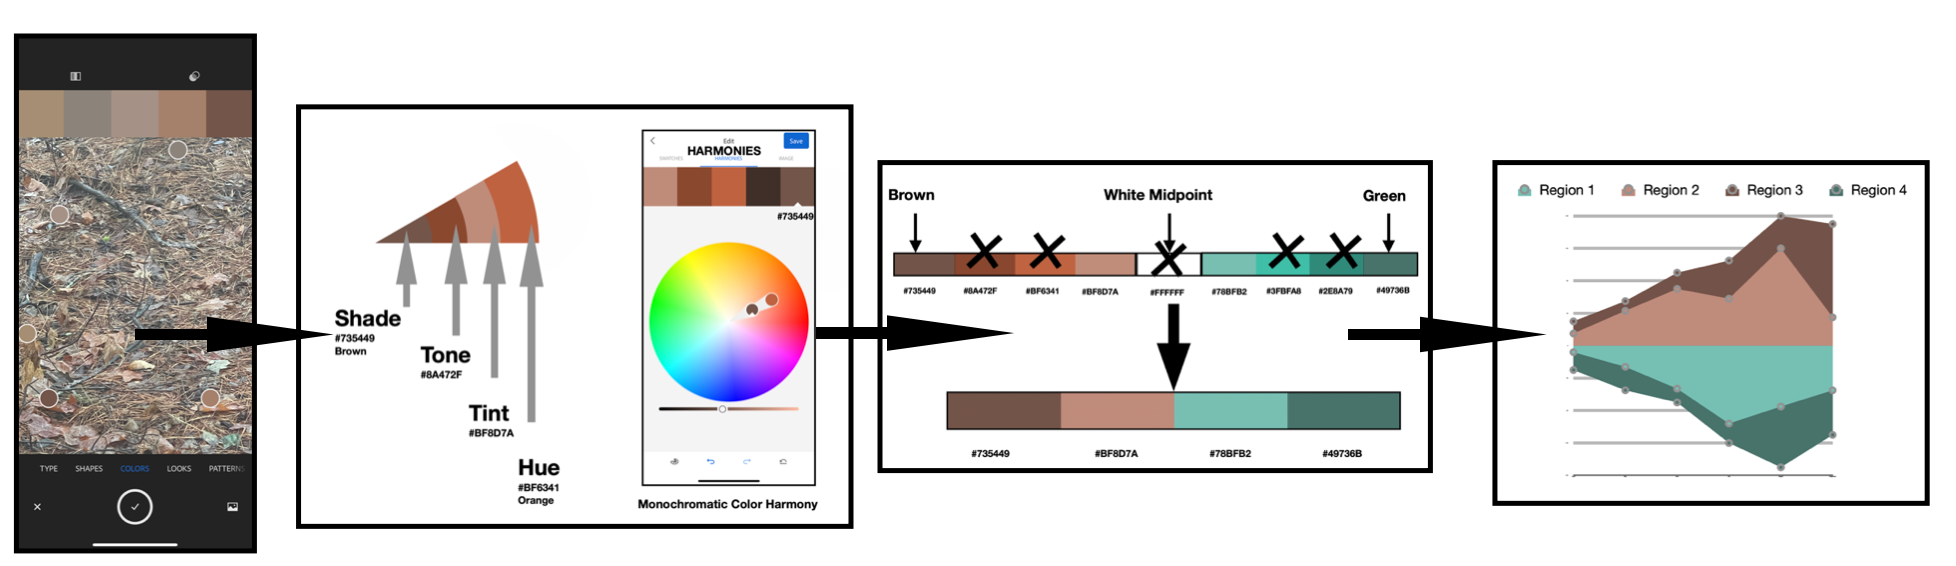
When brown becomes a shade of orange in data visualization

Using the color Brown to create sequential and diverging color schemes.

Continue reading on UX Collective »

Related posts:

  1. They are all around us: 6 archetypes of self-assessed “UX designers”
  2. How to Gain Insights from Emotionally Charged Questions
  3. The power of beauty in communicating complex ideas
  4. 13 Top Great Question Alternatives & Competitors in 2024
Published July 2, 2022By devie
Categorized as UX Tagged data

Post navigation

Previous post

What is a Design System? A simple guide to get started

Next post

Create a Dismissible Alert With JavaScript (and localStorage)

iDevie
Proudly powered by WordPress.