While growing up in Western PA, like most kids, I grew up loving and playing football and becoming a Pittsburgh Steelers fan. As NFL devotees, we endured a surreal 2020 football season with the pandemic from empty stands replaced by cardboard fans to injury reports containing COVID19 infections. Yet, with all its quirks, I’m grateful for the season; it was one of the few activities that provided us a bit of comfort and a sense of normalcy.

While watching the games this year, I was intrigued by the similarities of the NFL to Design. Of course, some similarities have always been there, such as watching game films and measuring player statistics (e.g., touchdowns, passing yards, fumbles). However, this year the NFL inaugurated a few new trends in partnership with Amazon. Their partnership is leveraging innovations such as Artificial Intelligence (AI) and the Internet of Things (IoT). For example, they use IoT sensors to granularly track player behavior (e.g., speed, proximity, impact) and glean an expressive view of the game and players. Moreover, they can apply this knowledge using AI to build propensity models to help coaches make informed decisions in critical situations.
As we know, Product or UX/UI Design can often be misunderstood. Unfortunately, even today, we still struggle with ”can you make it look pretty?” requests. While vital, good aesthetics are only a fraction of our profession. With this in mind, I’ve found comparisons with mainstream notions serve as a terrific way to illustrate the design nuances for stakeholders. In this article, I hope to reveal the advantageous parallels between the NFL and the Design discipline.
- Watching Game Film — study video to observe and surface latent behavior
- Next Generation Statistics — advance beyond standard measures to build a comprehensive understanding.
- Deep Analysis & Propensity — discover unforeseen patterns and predict circumstances
By no means comprehensive, but I hope you’ll learn a few new techniques for your craft and help to convey the breadth and significance of good design.
1. Watching Game Film
The lion’s share of work for games happens before the game as research. Before games, coaches and players spent hours studying opponents by watching hours and hours of film. They search for and discover patterns (e.g., plays called in third and long) and latent behavior (e.g., linebackers disguising their blitzes) to advise the team of the opponent’s strengths and weaknesses. The research enlightens the team, better prepares them for the game, and boosts the odds for winning games.
How it relates to design?
Just as coaches and players watch the film and evaluate patterns or weaknesses, we do the same as designers and researchers through usability tests or observing videos of actual users. Allow me to describe a few examples.
“You’ve got to start with the customer experience and work backward to the technology.”
— Steve Jobs
Baseline Usability Testing
Baseline usability testing is a practical way to quantify the behavior of users interacting with your experience. It also allows you to establish a baseline to measure the impact of proposed alterations. As designers, we need to quantify the benefits of our work and report to stakeholders the benefits of the design enhancements. For example, a System Usability Scale (SUS) is a reliable way to examine the usability of an experience. If you score 30 on the existing experience, and your new experience receives a 70 score, you’ve significantly improved it. Not only can you evaluate your experiences, but using competitors as a baseline or comparison is useful to compare yourself against rivals.
Discovery/Exploratory Testing
You can uncover significant value by merely testing your experiences or competitors with target users. For example, you can observe challenges or discover latent needs not expressed verbally by users when performing tasks. Additionally, if you use a speak-aloud technique, you can glean language choices, mental models, and anecdotes to inform your design process further and build empathy.
Evaluative or Validation Testing
As you generate concepts and prototypes to validate hypotheses, you can conduct tests with target audiences. Watch the testing videos; you’re able to glean insights on product fit, task success rates, and general cumbersomeness. Further, you can confirm user language choices by asking users to speak aloud during the test.
“In the wild” evaluation is a terrific method to observe the unaided and natural behavior of actual users on your website or app. Essentially, it’s seeing them in their natural habitat as they normally would use your experience with their context, mental model, and probable distractions. Using session replay tools such as Quantum, you can target problematic user sessions to expose user behavioral insights and challenges while using your experience.
Helpful Tools & Resources
- UserTesting: The Human Insight Platform
- Maze | User Research & Testing Platform
- Continuous Product Design | Quantum Metric
- System Usability Scale (SUS) Surveys – Airtable Universe
2. Next Generation Statistics
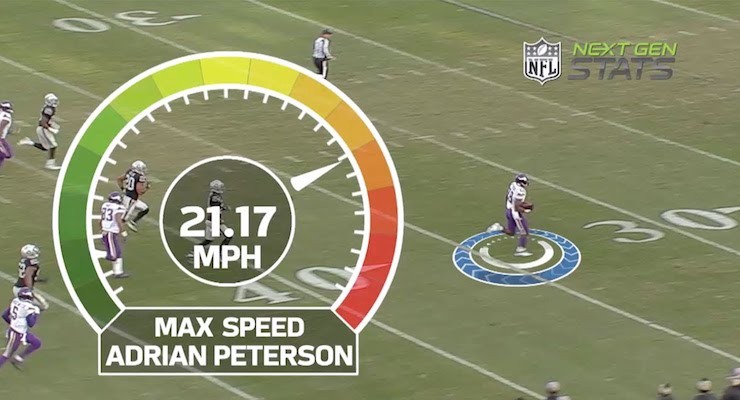
In the NFL, player stats are a major part of the game, whether tracking player passing yards, the number of sacks, or YAC (yards after the catch). Coaches use these measures as a way to evaluate players or strategies. Players boast and leverage these metrics to be selected to the NFL Pro Bowl or sign a lucrative deal. Fans follow them for their fantasy football league or just for entertainment.
Throughout the 2020 season, I’ve noticed an explosion of new granular measurements the NFL now tracks, thanks partly to a few innovations germinated through their partnership with Amazon. Presently, the NFL weaves sensors into player’s gear to track a multitude of data points such as player speed, players’ proximity, impact strength, or even how quickly a quarterback throws the ball. With this abundance of data, the NFL can build a deep understanding of player behavior, nourish the fan’s insatiable appetite for statistics, and proactively monitor cumulative impacts endured by players so they can avoid future traumas.
How it relates to design?
Like the NFL, we track statistics for users in the form of page views, visits, and clicks to understand behavior and experience performance. However, just as the NFL has progressed beyond basic statistics and towards more intricate measures, we should follow suit and expand from these fundamental measurements. By no means are these metrics meaningless; however, they don’t depict the whole story, and a headache to string them together to tell one.
Toybirds Scenario
Let’s walk through a simple scenario for a fictitious company named Toybirds. The experience is simple; people can find, buy and donate a toy to a child in need—a bit like Bombas. For the experience, we have all the basic tracking in place (visits, pageviews, button clicks, etc.).

Event-Based Analytics
In addition to tracking pageviews, we will add more fidelity to the instrumentation by implementing event-based analytics. Using the approach, we will benefit from simpler reporting, an omnichannel view, and comprehensive user behavior data.
Flow-aligned Measurements—for this experience, we’ll add flow-aligned events such as “payment page loaded,” “added payment,” and “picked destination country,” which are triggered when a user interacts with the page. By labeling events in this flow-centric and readable manner, we substantially reduce the complexity of reporting; therefore, ensuring we can quickly measure and diagnose the success of flows without days of aggregating data.
Richer Instrumentation—where the magic happens is our ability to add more backstory to these events using data layers. Using data layers, each event can 1) store attributes about the user who carried out the event or 2) include information about the event itself. For example, we can include perhaps the age, the number of children, or interests for users as they perform the interactions. Also, we can tag attributes about the event such as purchase price, location, amount, quantity, etc. Consequently, helping us better know each user’s behavior and adapt to our experiences to suit.
These extensive analytics methods aren’t new. They have been used for years in the gaming industry for gauging gaming mechanics. Remember Farmville? They pioneered event-based analytics and possibly had an event labeled “planted_something” with attributes such as plant type, location, age, and others. The good news is most modern analytics tools such as Google Analytics, Mixpanel, Intercom, or Adobe Analytics offer the capability. Further, most event-based analytics libraries support several platforms such as web, mobile, SmartTVs, or wearables.
Ok, getting back to Toybirds and the events we created earlier, specifically the “added payment” event. In the event attributes, we store the type of payment they select (e.g., PayPal, Credit Card, or Apple Pay). Doing this informs us on what payment type they select, therefore amplifying our backstory.
It may seem overboard to catalog this data but considerably returns on the investment. From quickly interpreting behavior to diagnosing problems, access to this data is vital for delivering modern experiences. For example, in the case of Toybirds, we can promptly answer questions such as:
- What payment option is most popular?
- What is the average age of people buying a stuffed giraffe?
- Do people with one child buy more expensive toys?
Let’s explore a vital scenario with Toybirds. We are noticing a significant decrease in our purchase conversation rate. It went from 70% to 50%, which at scale creates a significant impact on revenue.
The team immediately attempts to discover why the abrupt change in conversion. Using the typical statistics such as pageviews and button clicks, they found the payment page wasn’t converting. At this juncture, determining why is a bit of a guessing game. Likely to follow are numerous meetings, hours of discussion, and debate to surface a few hypotheses to trial.
Nonetheless, we can quickly formulate a cohort of users who are not converting and begin to form our backstory with event-based tracking. After a modest examination, we discover a notable set of the people who trigger the “added payment” event and select PayPal is not converting.
With a brisk diagnosis, the design team dives deeper to comprehend why by watching several select session replays. Finally, after watching a few sessions, the reason is apparent; the PayPal login has stopped working — a technical problem. With this useful insight, the design team shares the interaction evidence with the development team to resolve the defect. If the evidence was with usability concerns, the design team could prototype and test variations to improve the experience.
As seen in our Toybirds example, advancing our analytics to track more granular measures can help us build a robust awareness of user behavior, diagnose changes in behavior, and assure experiences perform well.
Resources
- Event Measurement | Analytics for Web (analytics.js)
- How to choose the right UX metrics for your product
- Product Analytics for Mobile, Web, & More | Mixpanel
- Conversational Relationship Platform | Intercom
3. Deep Analysis & Propensity
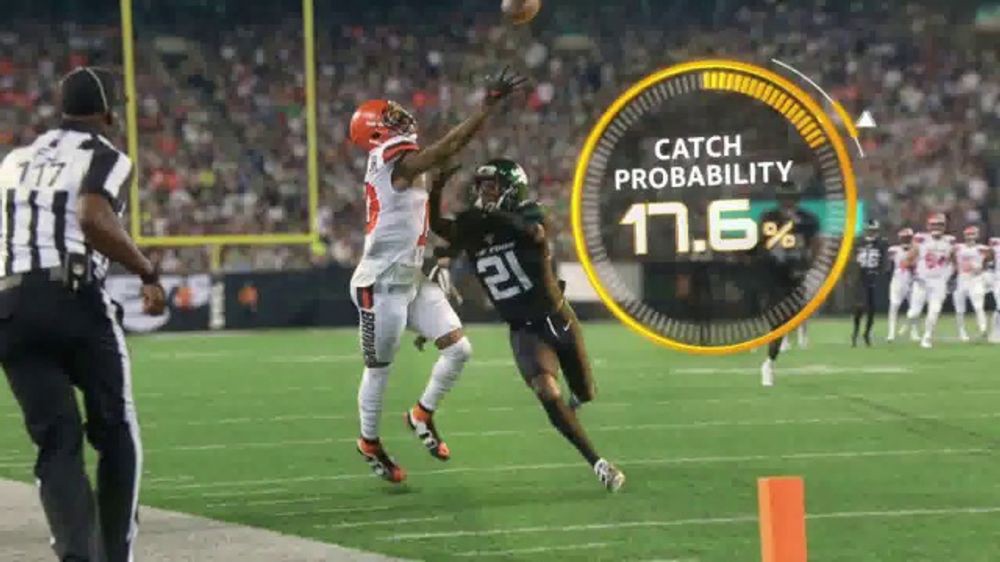
Bolstered with the confluence of game statistics and fresh instrumentation data, the NFL can reach a heightened level of wisdom. With this robust information and AI, the NFL can comprehend player behavior and surface latent patterns rather than what is gleaned through hours and hours of watching film. For example, they can realize the average time it takes a particular quarterback to through the ball or when do safeties typically blitz. Additionally, they can further assemble this data to build predictive or propensity models. For instance, coaches can predict the probability of plays in particular scenarios; what are the chances of making a two-point conversion in the fourth quarter when down by 1 point. Additionally, they can share this knowledge with avid enthusiasts and further sweeten their experience.
How it related to design?
With client experiences, there is a heightening expectation from users that we infer their wishes. They expect experiences to tailor to their interests and behaviors without effort. Commonly, people tend to ignore personalization options. If they do share preferences, it is often narrow and doesn’t correspond to their genuine behavior. Additionally, evaluating and predicting behavior helps to spot patterns and make more informed design decisions quickly. Not comprehensive, but a few scenarios illustrating the benefits of using AI and event-driven analytics.
Gradual Curation
Using robust data, we can establish propensity models that can subtly tune the experience based on an analogous profile behavior. For example, we may see that people in the Midwest have a high propensity to purchase a particular type of toy during the spring. With this knowledge, we can curate and surface toys that likely will suit their desires. We can further refine the more we learn more about them. Contrast this example with a generic one-size-fits-all approach which forces them to exert additional effort searching for the desired toy. By no means a perfect match, though the refinement can greatly increase the likelihood of a purchase, satisfaction, and building an emotional bond with the brand.
Smart Defaults
Another example could be informing Smart Defaults. Striving to reduce friction in the flow, we can anticipate the payment option. If 90% of lookalikes (iOS, Millennials) use Apple Pay, it will be prudent to default ApplePay as the payment option. It may seem trivial, but the more we can reduce cognitive burden and friction, the further we streamline and deliver more useful and enjoyable experiences.
Behavioral Cohorting
We can use AI to examine data to materialize cohorts of users enact proactive strategies. For instance, we discover a large cohort of people who fail to enable push notifications. Also, the cohort has the propensity to cancel in 90 days. We can use this insight research why and potentially adjust our First-time User Experience to encourage new users to enable push notifications.
Summary
As the NFL coaches and players invest their time watching game film preparing for the next opponent, it’s essential as designers and researchers we continually watch film to observe and evaluate our experiences.
The NFL has advanced beyond the basic statistics and tracking players using IoT. A multitude of next-generation statistics delivers to coaches, players, and fans with an exciting perspective on the game. As we design experiences, using event-based analytics narrates a comprehensive backstory and empowers us to monitor and diagnose experiences ensuring successful outcomes effectively.
Using AI to analyze standard and next-generation statistics, coaches can quickly discover latent patterns, predict plays, and confidently lead the team to win games. Likewise, designers and researchers can uncover patterns, tune experiences, and deliver frictionless experiences that enable more successful client outcomes and reduce expensive development rework.

![]()
Design lessons from the National Football League (NFL) was originally published in UX Collective on Medium, where people are continuing the conversation by highlighting and responding to this story.