Summary:
Analyze usability findings for authenticity, consistency, repetition, spontaneity, appropriateness, and confounding factors to separate surface impressions from real insights.
Qualitative usability tests yield two types of data: behavioral data (or performance data) and attitudinal data (or subjective data). During analysis, we must consolidate both types of data while considering additional factors, such as information about the study design or recruitment.
Why You Can’t Take a Data Point at Face Value
Consider the following example.
You’re moderating a usability test of a prototype, aiming to evaluate the usefulness of a comparison feature. After completing a task on the prototype, 4 out of 5 users said that they liked the feature and would use it in the future.
From this account you’d be forgiven for thinking that the feature tested well and no changes to the design are required. But, what about if:
- Only one participant actually used the feature — and they struggled with it.
- The positive feedback was provided only after the facilitator asked whether the participants liked the comparison feature.
- The comparison feature wasn’t mentioned during the end-of-test followup questions on what was easy or difficult.
- When asked to find a suitable product, all participants quickly chose one and didn’t explore other available options.
Would this change your assessment of the utility of the comparison feature? Probably!
Sometimes, what users say contradicts what they do. And, sometimes, what users say at one point in a session contradicts what they say later in the session!
This is why, when analyzing usability test data, each data point must be assessed in the context of other data points and paired with information about the recruitment strategy, study design, and facilitation events.
This is partly why you can’t trust AI to analyze usability tests. Currently, AI tools cannot process or “watch” the recordings, so they miss context. They also aren’t intelligent enough to know you asked a leading question or that a participant was not an appropriate recruit.
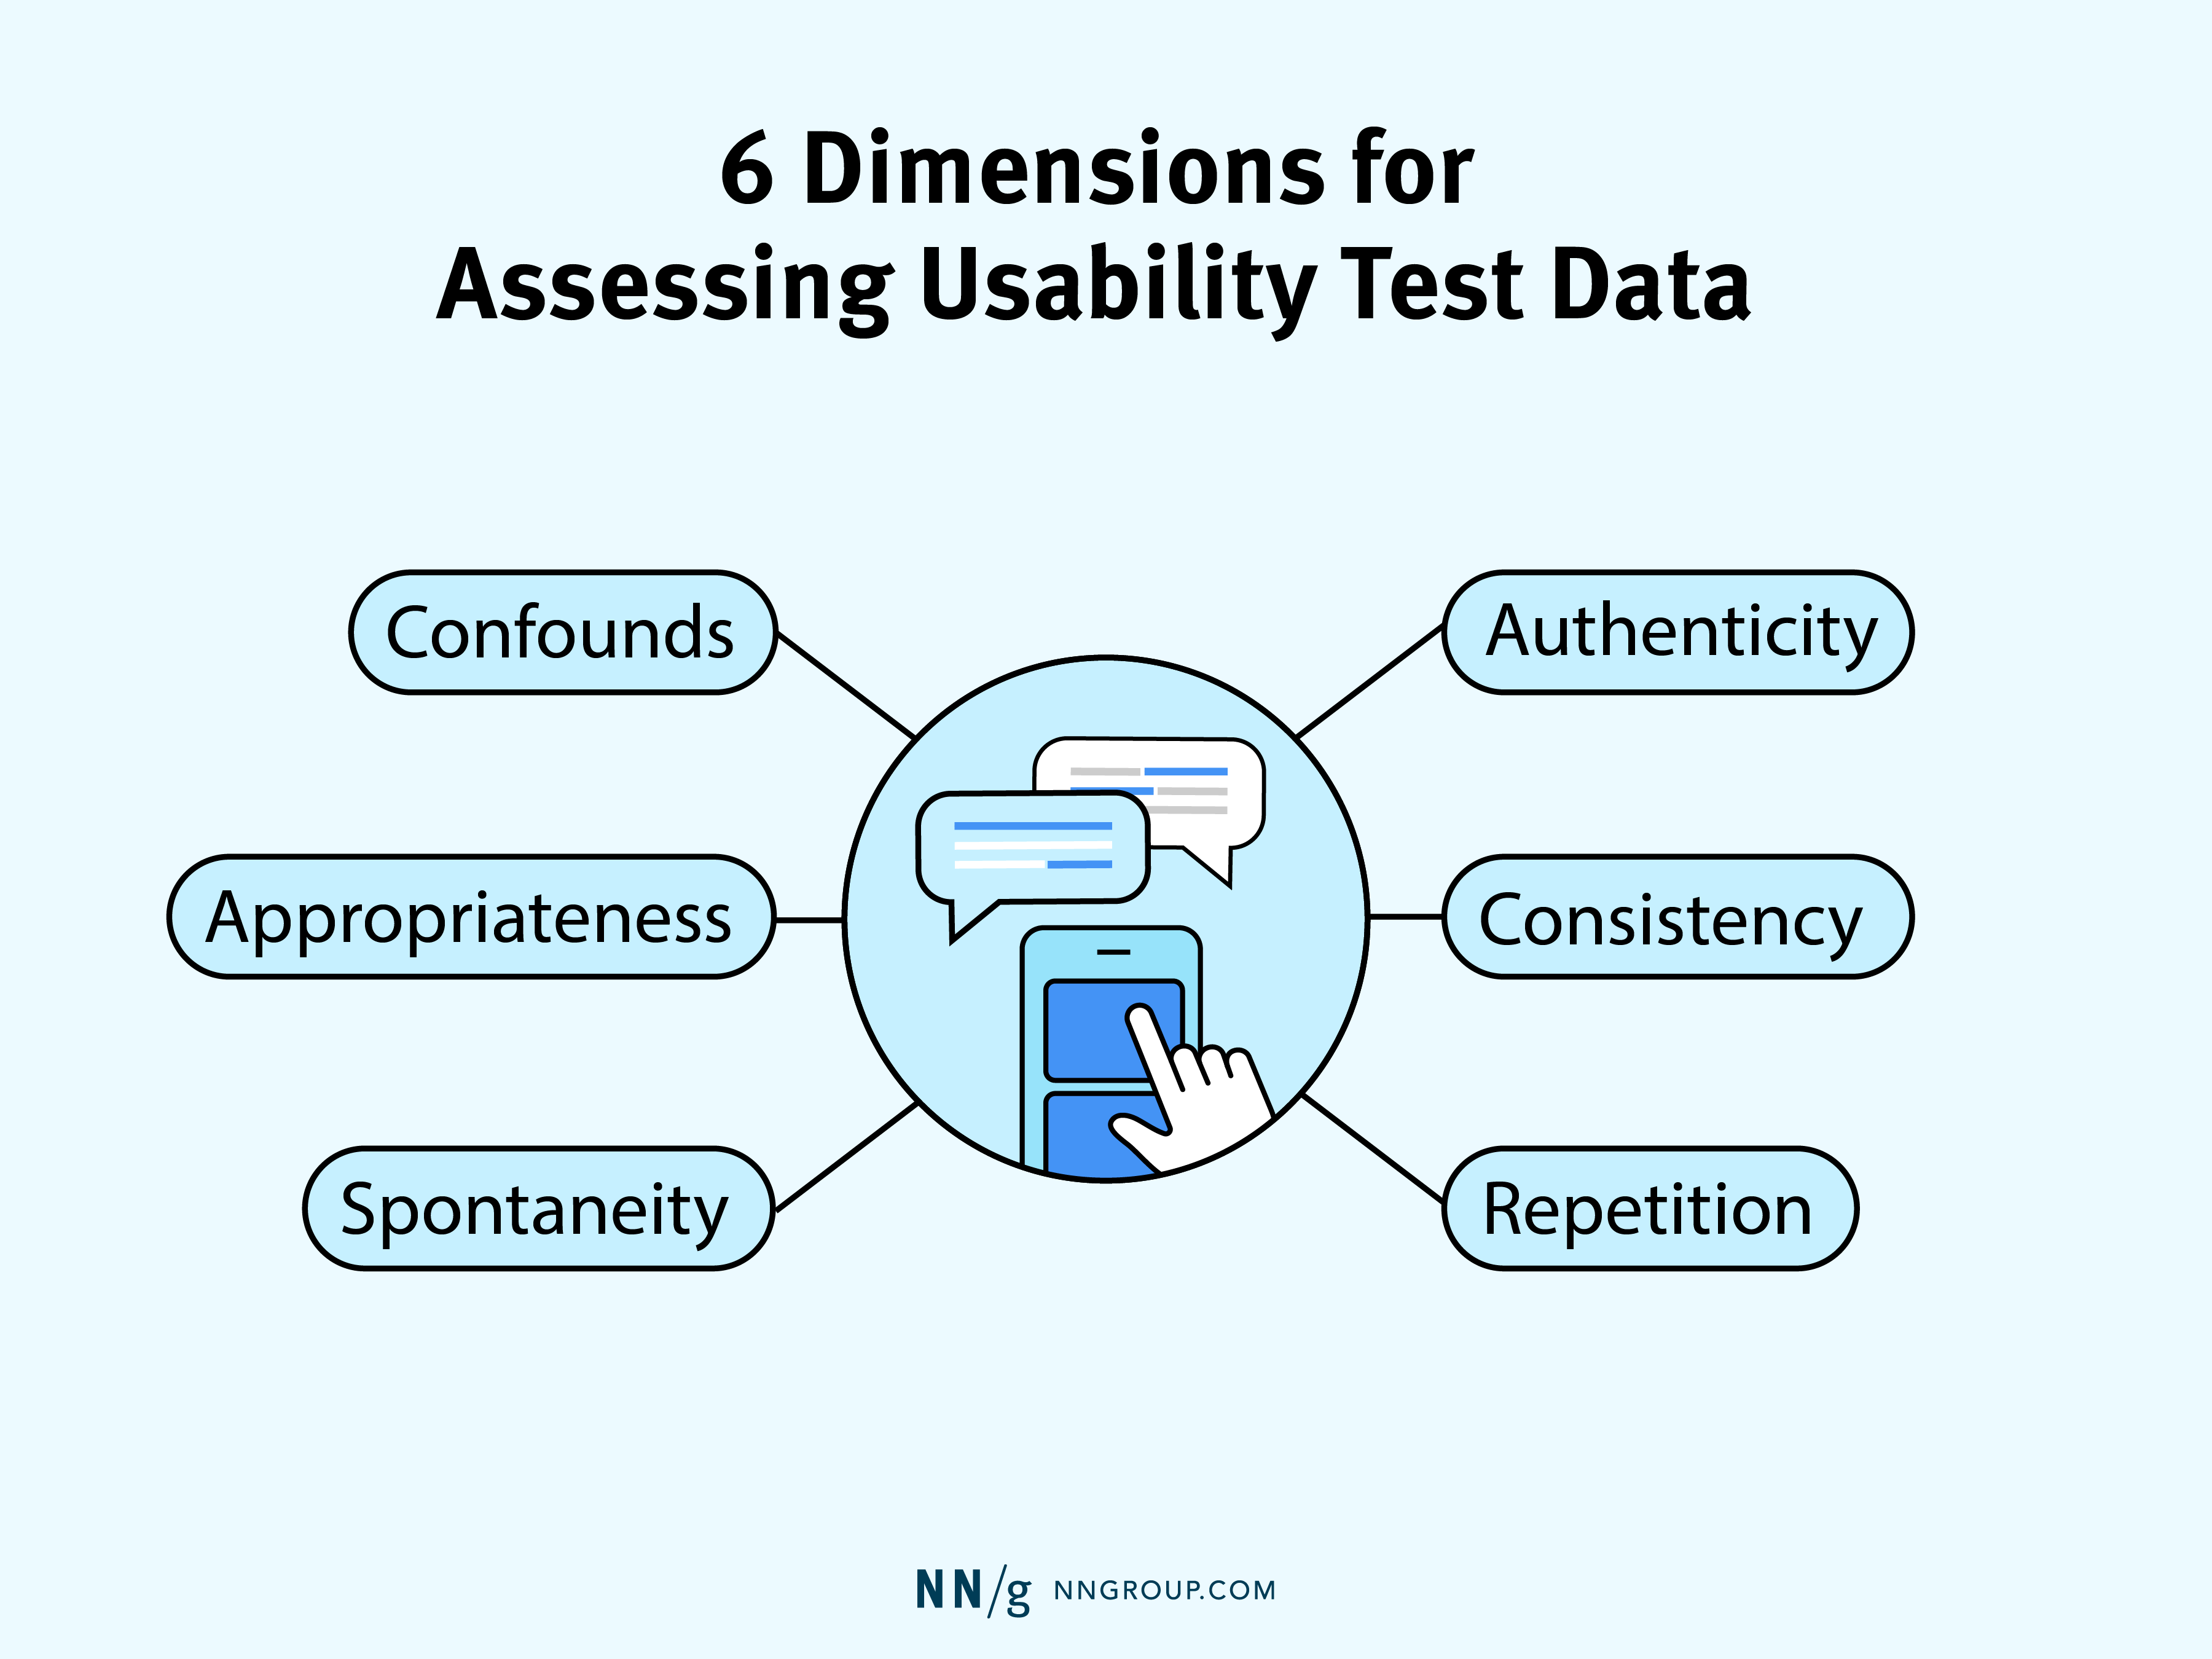
6 Dimensions for Assessing Qualitative-Date Relevancy
Each data point we consider in the qualitative-data analysis should be examined on 6 key dimensions or lenses to assess its accuracy and relevance.
- Authenticity
- Consistency
- Repetition
- Spontaneity
- Appropriateness
- Confounds
We’ve also created the following mnemonic to help you remember them.
All Curious Researchers Stop and Analyze Carefully.
Authenticity
This dimension refers to how natural the comment or behavior was. When a participant commented that they liked something, did they mean it? While we can’t read minds, we do make judgments about things our participants say by paying attention to how something is said or done.
- Was the participant trying to please the session facilitator?
- Did the participant feel compelled to comment on a feature or design?
There are various reasons why a comment or behavior may not be authentic. The participant might have been influenced by how we framed the research, may have been a misrecruit or professional participant, or may have altered their behavior because they were conscious of being “watched.”
Consistency
This dimension refers to how much a data point (whether verbal or behavioral) is consistent with others. For example:
- Did a participant say something that contradicts another piece of feedback they gave at a different point in time?
- Did a participant’s comment align with their behavior?
For example, a participant might say that a task was easy, but their behavior tells a different story — they struggled, made errors, or restarted multiple times. This mismatch can happen when participants want to be polite to the researcher or are reluctant to admit difficulty. When inconsistencies between behavioral and verbal data occur in usability testing, pay more attention to what people do than to what they say.
Repetition
This dimension considers how often a comment or behavior occurs across a session or participants. Repeated behaviors can reveal underlying patterns, tendencies, or mental models. Repeated comments often reflect strong, genuine emotions or attitudes.
For example:
- Repetitive comments: If a participant mentions liking a feature multiple times, we may be more confident that the sentiment is authentic.
- Repeated errors: When several participants make the same error, or we see the same error repeated in the same session, it’s a strong indicator of a real usability issue.
Spontaneity
This dimension refers to whether the participant’s comment or behavior were cued in some way by the facilitator. When actions or comments are introduced spontaneously, without any priming, we can be more confident that the feedback or behavior is genuine.
Watch out for priming, as it can skew participants’ spontaneous behavior. For example:
- Revealing the study purpose too early, such as during the session introduction or directly in the usability-testing tasks
- Mentioning UI elements or features in questions or conversations
Appropriateness
This dimension relates to whether the participant and task were well-suited to the research goals. Key questions to consider include:
- Was the participant representative of the target user?
- Did the participant sample adequately reflect the characteristics of the target user population?
- Was the task realistic and fair, or did it ask participants to do something they wouldn’t typically do?
Confounds
This final dimension looks at aspects of the study design that may unintendedly influence participant behavior and skew results. Common issues include:
- Order effects: Did completing one task impact how participants approached subsequent tasks? For example, if the test included many repetitive tasks, participants might have become bored or fatigued towards the end, which could affect performance.
- Complex task instructions: When task wording isn’t clear — too long, overly technical, or not in plain language — participants may struggle to complete the activity, even if the design itself works well.
Conclusion
In usability testing, no single data point tells the whole story. Each data point must be examined critically and contextually: what users say, what they do, and how the study was run all shape the insights we draw. Apply the 6 dimensions — authenticity, consistency, repetition, spontaneity, appropriateness, and confounds — to avoid being misled by surface-level signals and to draw insights you can trust.