SVG is powerful and flexible graphic format, which fits perfectly into the web medium. Unlike raster image formats, such as JPG, PNG, or GIF, SVG is vector-based and consists of “real” objects, which you can select and manipulate in whatever manner you want. So even with some basic scripting a static image can be animated and made interactive. And that will be the subject of this tutorial.
SVG and Vue: The Perfect Match
To demonstrate how SVG can be scripted, I selected Vue.js. The reason behind my choice is that, in my opinion, SVG and Vue make the perfect match. First, Vue supports SVG out of the box. And second, SVG, like HTML, is XML-based so we can apply Vue’s reactivity system to SVG and make it interactive in the same easy and convenient way as we do with HTML templates.
Quick Primer on Vue and SVG Integration
Before we get to the two use cases which we’ll explore below, let me give you a clue about the way SVG and Vue integration works.
To get started, we create a basic HTML file and include the Vue framework. Then, we put the SVG we want to manipulate inside.
<div id="app">
  <svg width="400" height="300">
    <rect @click="toggleStroke" x="10" y="10" :width="width" :height="height" :fill="color" stroke="green" :stroke-width="stroke"></rect>
  </svg>
</div>
Here, we have a rectangle object whose attributes are bound to the data object in the Vue instance. We also have a click event listener, which will invoke the toggleStroke() method. So when we click on the rectangle, the stroke will be toggled.
And here is the Vue code:
new Vue({
  el: '#app',
  data: {
    color: 'orange',
    width: 100,
    height: 100,
    stroke: 0
  },
  methods: {
    toggleStroke(){
      this.stroke == 0 ? this.stroke = 5 : this.stroke = 0
    }
  }
})
As you can see, it’s super easy to combine Vue and SVG. Now, let’s explore the more realistic and useful examples.
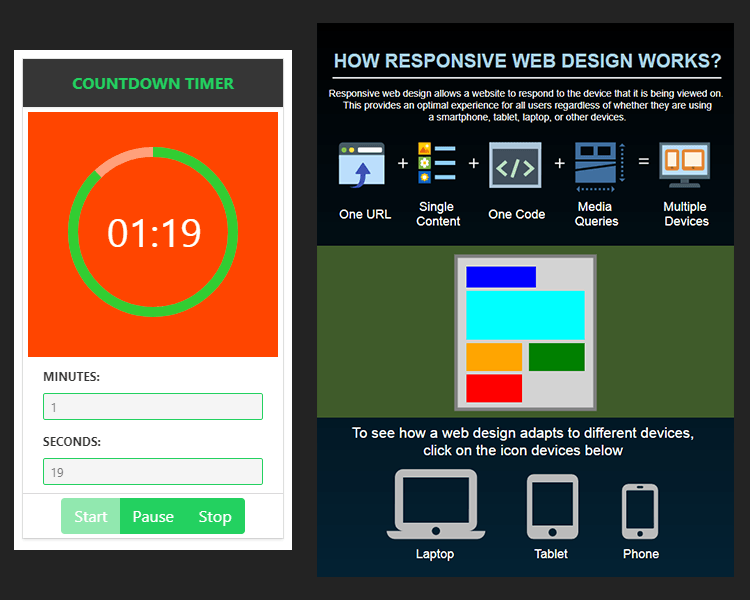
Example One: Creating a Countdown Timer Widget
In the first example, we’ll create a countdown timer widget. It will allow users to set minutes and seconds for a given time period and when started the timer will show the remaining time in a circular progress. To draw and animate the progress, we’ll use a SVG circle object and its stroke-dasharray attribute. You can read about the SVG circular progress technique here. Also, to add some structure and nice styling, we’ll use the Card component from the Bulma. So make sure you’ve added the framework to your file.
We start by adding a card component and then put a header inside with the title of our widget.
<div id="app">
  <div class="card">
    <header class="card-header has-background-grey-darker">
      <p class="card-header-title has-text-success">COUNTDOWN TIMER</p>
    </header>
  </div>
</div>
Next, we use the image section of the card to put our SVG.
<div class="card-image">
  <svg xmlns="http://www.w3.org/2000/svg" viewbox="0 0 260 250" width="260" height="250">
    <rect x="5" y="5" width="250" height="250" fill="orangered" />
    <circle cx="130" cy="125" r="80" stroke="lightsalmon" stroke-width="10" fill="none" />
    <circle cx="130" cy="125" r="80" stroke="limegreen" :stroke-dasharray="dasharray" stroke-offset="600"
      stroke-width="10" fill="none" transform="rotate(270,130,125)" />
    <text x="84" y="140" fill="white" font-size="40">{{ minute | formatTime }}:{{ second | formatTime }}</text>
  </svg>
</div>
Here, we have a rectangle which serves as a background. We use two circles to create the circular progress. We position them so they perfectly overlap. We set the fill attribute of the first circle to none and use only its stroke as an outline for the progress. To create the illusion of circle drawing we bind stroke-dasharay attribute of the second circle to the dasharay() computed property, which we’ll create a bit later. Also, we want the starting point of the drawing to be at 12 o’clock and not at 3 o’clock which is the default. To do this, we rotate the point by using the transform attribute. The last object is the text, which we position in the circle’s center. To display the time correctly, with a leading zero, we apply the formatTime() filter, which we’ll create later.
Next, we need to add the controls for the minutes and seconds.
<div class="card-content">
  <div class="field is-horizontal">
    <div class="field-label">
      <label class="label is-size-7">MINUTES:</label>
    </div>
    <div class="field-body">
      <div class="field">
        <div class="control">
          <input class="input is-success is-small" :disabled="state==='started' || state==='paused'" @change="updateTime"
            v-model="minute" type="number" name="minutes" min="0" max="59" step="1">
        </div>
      </div>
    </div>
  </div>
  <div class="field is-horizontal">
    <div class="field-label">
      <label class="label is-size-7">SECONDS:</label>
    </div>
    <div class="field-body">
      <div class="field">
        <div class="control">
          <input class="input is-success is-small" :disabled="state==='started' || state==='paused'" @change="updateTime"
            v-model="second" type="number" name="seconds" min="0" max="59" step="1">
        </div>
      </div>
    </div>
  </div>
</div>
The important controls here are the inputs, which we bind with the corresponding Vue properties by using the v-model directive. We also disable them when the state is set to started or paused. Finally, we add a change event listener, which will call updateTime() method.
And finally, we add the buttons to control the timer.
<footer class="card-footer">
  <div class="buttons has-addons card-footer-item">
    <button class="button is-success" :disabled="state==='started' || second==0 && minute==0" @click="start"><span>Start</span></button>
    <button class="button is-success" :disabled="state!=='started'" @click="pause">Pause</button>
    <button class="button is-success" :disabled="state!=='started' && state !== 'paused'" @click="stop">Stop</button>
  </div>
</footer>
Here, we again add click event listeners and some conditions to the buttons, so they will be disabled when not needed.
So far we’ll need some CSS to correct the spacing and aligning of some timer’s parts.
#app {
  width: 260px;
  margin: 10px;
}

.card-header-title {
  justify-content: center;
}

.card-content {
  padding: 4px 20px 8px;
}

.card-footer-item {
  padding: 4px;
}
And now, it’s time to add the Vue code to the equation.
new Vue({
  el: '#app',
  circumference: 2 * Math.PI * 80,
  data: {
    state: 'stopped',
    minute: 0,
    second: 0,
    progress: 0,
    timeInSeconds: 0
  },
  computed: {
    dasharray(){
      return this.progress + " " + this.$options.circumference
    },
  }
})
First, we define the necessary properties in the data object and we add the circumference of the circles as a custom option of Vue instance. The latter is because we need circumference to be static but not reactive. We create dasharay() computed to calculate the values for the stroke-dasharay attribute.
Now, let’s add the methods:
methods: {
  updateTime(){
  this.timeInSeconds = Number(this.minute) * 60 + Number(this.second)
},
start() {
  this.state = "started";
  if (this.progress == 0){
    this.progress = this.$options.circumference;
  }
  this._tick();
  this.interval = setInterval(this._tick, 1000);
},
pause() {
  this.state = "paused";
  clearInterval(this.interval);
},
stop() {
  this.state = "stopped";
  clearInterval(this.interval);
  this.minute = 0;
  this.second = 0;
  this.progress = 0;
},
_tick: function() {
  //if second is 0 and minute is 0, clear the interval
  if (this.minute == 0 && this.second == 0){
    this.stop()
  }
  //update progress
  let delta = (this.$options.circumference / this.timeInSeconds)
  if ((this.progress - delta) < (delta / 2)){
    this.progress = 0
  } else {
    this.progress -= delta
  }
  //if second is not 0, just decrement second
  if (this.second !== 0) {
    this.second--;
    return;
  }
  //if second is 0 and minute is not 0, decrement minute and set second to 59
  if (this.minute !== 0) {
    this.minute--;
    this.second = 59;
  }
}
}
The updateTime() method updates the value of timeInSeconds property each time when the values changed.
The start() method changes the state to started and invoke the _tick() method every second.
The _tick() method handles the proper update of the progress, minute and second props.
The pause() method changes the state to paused and stop the clock by clearing the interval.
The stop() method changes the state to stopped, stop the clock, and reset the progress, minute and second props.
And finally, we add the formatTime() filter to handle the proper display of the time.
filters: {
  formatTime: function(value) {
    if (value >= 10) {
      return value;
    }
      return "0" + value;
  }
}
And that’s it! We successfully used Vue’s reactivity features to transform our static SVG drawing into an interactive countdown timer. Let’s move on to the next example.
Example Two: Creating a SVG Infographic
In this example, we’ll create a small infographic demonstrating what responsive web design is and how it works. Thanks to Vue, we’ll be able to animate our SVG illustration and make it more realistic and engaging.
I created the static parts of the infographic in Illustrator, and then exported it as SVG. Then I added the dynamic parts manually. The dynamic parts are three wireframes, which simulate how one and the same web design is viewed on different devices. Let’s create them now.
First, let’s create the data objects necessary for the different wireframes.
const laptop = {
  r1: {x: '100', y: '335', width: '400', height: '220'},
  r2: {x: '115', y: '350', width: '200', height: '30'},
  r3: {x: '115', y: '390', width: '370', height: '70'},
  r4: {x: '115', y: '470', width: '110', height: '40'},
  r5: {x: '245', y: '470', width: '110', height: '40'},
  r6: {x: '375', y: '470', width: '110', height: '40'},
}

const tablet = {
  r1: {x: '200', y: '335', width: '200', height: '220'},
  r2: {x: '215', y: '350', width: '100', height: '30'},
  r3: {x: '215', y: '385', width: '170', height: '70'},
  r4: {x: '215', y: '460', width: '80', height: '40'},
  r5: {x: '305', y: '460', width: '80', height: '40'},
  r6: {x: '215', y: '505', width: '80', height: '40'},
}

const phone = {
  r1: {x: '220', y: '335', width: '160', height: '220'},
  r2: {x: '225', y: '340', width: '150', height: '30'},
  r3: {x: '225', y: '375', width: '150', height: '70'},
  r4: {x: '225', y: '450', width: '150', height: '30'},
  r5: {x: '225', y: '485', width: '150', height: '30'},
  r6: {x: '225', y: '520', width: '150', height: '30'},
}

new Vue({
  el: '#app',
  data: {
    d: {
      r1: {x: '100', y: '335', width: '400', height: '220'},
      r2: {x: '100', y: '335', width: '400', height: '220'},
      r3: {x: '100', y: '335', width: '400', height: '220'},
      r4: {x: '100', y: '335', width: '400', height: '220'},
      r5: {x: '100', y: '335', width: '400', height: '220'},
      r6: {x: '100', y: '335', width: '400', height: '220'},
    }
  },
})
Every wireframe consists of six rectangles, so for each design we create a separate data object with the necessary values. In the Vue instance, we create another one, which will be the base object.
Now, let’s create the SVG rectangles necessary for the wireframes and bind their attributes to the data values:
<rect :x="d.r1.x" :y="d.r1.y" :width="d.r1.width" :height="d.r1.height" fill="lightgrey" stroke="grey" stroke-width="5"/>
<rect :x="d.r2.x" :y="d.r2.y" :width="d.r2.width" :height="d.r2.height" fill="blue" />
<rect :x="d.r3.x" :y="d.r3.y" :width="d.r3.width" :height="d.r3.height" fill="cyan" />
<rect :x="d.r4.x" :y="d.r4.y" :width="d.r4.width" :height="d.r4.height" fill="orange" />
<rect :x="d.r5.x" :y="d.r5.y" :width="d.r5.width" :height="d.r5.height" fill="green" />
<rect :x="d.r6.x" :y="d.r6.y" :width="d.r6.width" :height="d.r6.height" fill="red" />
Next, we create the animation method with the help of Tween.js. So make sure you’ve added that library to your file. We use the Vue created() lifecycle hook to initially animate the wireframe from the base object to the laptop design wireframe.
created(){
  this.anim(laptop)
},
methods: {
  anim(val){
  function animate(time) {
    requestAnimationFrame(animate);
    TWEEN.update(time);
  }
  requestAnimationFrame(animate);
  new TWEEN.Tween(this.d.r1).to(val.r1, 1000).start();
  new TWEEN.Tween(this.d.r2).to(val.r2, 1000).start();
  new TWEEN.Tween(this.d.r3).to(val.r3, 1000).start();
  new TWEEN.Tween(this.d.r4).to(val.r4, 1000).start();
  new TWEEN.Tween(this.d.r5).to(val.r5, 1000).start();
  new TWEEN.Tween(this.d.r6).to(val.r6, 1000).start();
  }
}
And now, we add overlays to the device icons by positioning transparent SVG rectangles above them. This way the clicking area will contain the whole icons and not only their outlines. And finally, we add the click event listeners, which will call the anim() method with the selected design.
<rect @click="anim(laptop)" x="95" y="640" width="155" height="110" fill="transparent"/>
<rect @click="anim(tablet)" x="295" y="645" width="85" height="105" fill="transparent"/>
<rect @click="anim(phone)" x="435" y="660" width="60" height="90" fill="transparent"/>
So now, when we open the infographic, the laptop design will show up gently animated and when we click on the different device icons, the wireframe design will be updated accordingly by smooth animation. Cool, huh?
Conclusion
As you can see, SVG, in combination with Vue, can be very powerful and flexible. Vue makes super easy to access and manipulate SVG objects and to make them fully interactive. This way you can bring live to your static SVG graphics and make them dynamic and more pleasant to the users. Such an engagement can improve dramatically the UX and the overall appearance of your web site or application.