Summary:
UX ranks among top fields adopting AI, mostly in writing, design, and coding tasks — though complex or human-centric UX activities remain largely AI-free
An analysis of one million conversations with Claude.ai indicates that, while UX professionals represent less than 0.01% of the US workforce, they generate a remarkable number of AI conversations (7.5% of all Claude conversations). Thus, UX is among the top professions actively engaging with AI, predominantly in areas such as technical writing, web design, and copywriting. However, tasks requiring complex analysis or direct human interaction remain largely untouched by AI.
What does this concentration of AI usage imply for the future of UX work, opportunities, and compensation? This article discusses the UX tasks currently attempted with AI and those where human expertise still prevails.
Key Findings
Two and a half years after the release of ChatGPT, we find ourselves amid speculation regarding AI’s impact on the job market. Anthropic’s recent analysis of one million Claude.ai conversations assesses the current state of AI use by different professions and provides an important baseline that we can refer to in the future.
This article reports on Anthropic’s findings and expands them with my own UX-specific analysis of Anthropic’s dataset. The main takeaways include:
- Most American workers are not using AI for their jobs. AI usage for work is highly concentrated (77%) in digitally focused job roles like UX. that make up only about 30% of the workforce. So far, these occupations are in the top 25% of wages. (Anthropic’s finding)
- UX professionals use AI for their work more than most others. 7.5% of 1 million AI conversations were related to UX, placing UX among the top 5 occupations in terms of AI-conversation volume. Yet UX professionals make up less than 0.01% of the US workforce. (NN/g’s finding)
- People have attempted to use Claude for a little more than half (55%) of UX-related work tasks at least once. This puts UX firmly in the 94% percentile of all occupations — meaning that 94% of all occupations attempted to use AI for fewer tasks than UX. (NN/g’s finding)
- UX mostly uses AI for writing, design, and development tasks. Not surprisingly, most UX tasks performed with AI are computer-related activities falling under the umbrella of technical writing, web design and development, and copywriting. (NN/g’s finding)
- Most UX tasks not yet attempted with AI either involve direct interaction with other humans or are too complex. 42% of the UX tasks that were not attempted with AI involved interfacing with other humans (e.g., users, coworkers); another 20% involved complex analyses (e.g., design reviews). (NN/g’s finding)
Anthropic’s Data Set and Findings
Anthropic recently launched a data initiative aimed at understanding the ways in which AI changes how people work. Its first report analyzed one million anonymized conversations with Claude.ai. Researchers used artificial intelligence to cluster these conversations into categories matching various tasks and occupations, as described in a public dataset provided by the US Department of Labor.
Anthropic’s Analysis
Anthropic used the following 2 data sources:
- One million Claude.ai conversations carried out during Dec 2024-Jan 2025
- Descriptions of occupations and corresponding tasks from the O*NET database of occupations provided by the U.S. Department of Labor; this database contains approximately 20,000 task descriptions
Then it used a Claude-based analysis tool to assign each conversation to a single task. Once each conversation was thus classified, the Anthropic team calculated the percentage of Claude conversations that were assigned to each task. This dataset is publicly available.
Anthropic reported:
- The tasks with the largest percentage of AI use
- The occupations that showed the highest penetration of AI
Digitally Focused Occupations Show the Highest AI Usage
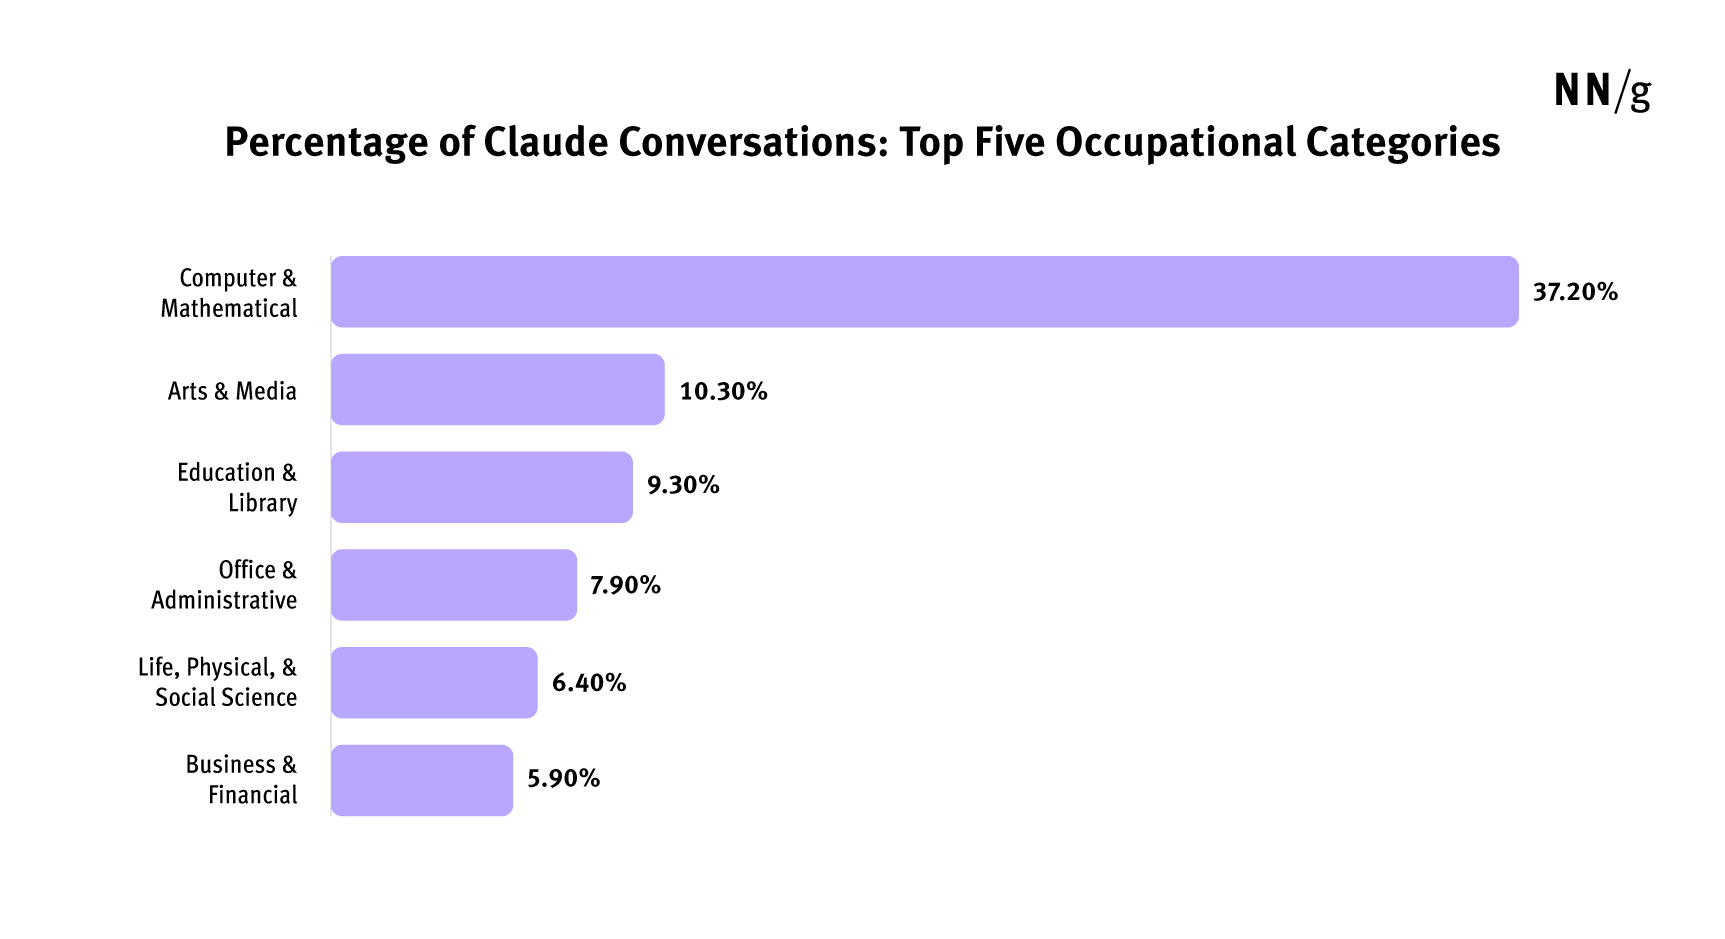
Perhaps unsurprisingly, Anthropic found that the Computer & Mathematical occupational category had the most conversations, containing 37% of the AI conversations in their dataset. The other categories that included more than 5% of the conversations were Arts & Media, Education & Library, Office & Administrative, Life, Physical, & Social Science, and Business & Financial. All these categories have a well-established, strong digital component.
More than 3 quarters of all conversations (77%) fell in one of these top 6 categories. Categories with low representation (e.g., Personal Care and Service, Community & Social Service, Sales & Related) were those that traditionally tend to require physical labor or face-to-face interactions.
One may wonder whether these top categories are simply the most common in the US workforce. In fact, even though three quarters of these conversations were in these 6 categories, these occupations make up only 30% of the US workforce.
Thus, so far, the majority of the US workforce makes only negligible use of AI. This finding aligns with a similar one from a recent Pew Research study, which suggested that the majority of American workers are not using AI in their jobs.
(Additionally, the Claude data likely includes conversations initiated by users outside of US, so the numbers reported per occupation will be even smaller if one looked only at US workers.)
AI-Chat Usage per Occupation
The Anthropic team also examined the extent of AI adoption for each occupation. It did this by looking at the percentage of tasks (out of the tasks for that occupation) that were attempted with AI. It found that only 4% of all occupations have at least 75% of their tasks attempted with AI.
For example, here are the four tasks associated with the occupation Shampooers (picked because it happens to have the least number of tasks):
- Massage, shampoo, and condition patron’s hair and scalp to clean them and remove excess oil.
- Advise patrons with chronic or potentially contagious scalp conditions to seek medical treatment.
- Treat scalp conditions and hair loss, using specialized lotions, shampoos, or equipment such as infrared lamps or vibrating equipment.
- Maintain treatment records.
Only the third out of these 4 tasks (treat scalp conditions and hair loss) was attempted with AI, corresponding to 0.004% of all Claude conversations. Thus, the Shampooers occupation has a depth of AI adoption of 1 out of 4, or 25% — in other words, only 1 task out of 4 was attempted with AI.
When I analyzed Anthropic’s dataset, I found that, on average, occupations had about 27% of their tasks attempted with AI, with half of the occupations having less than 22% of the tasks attempted with AI. That translates to 1 task out of 5 — meaning that, for most occupations, users think that Claude could help them only in a very limited way.
At the very high end, a high proportion of teaching professions had most tasks attempted with AI, emphasizing AI’s capacity to act as a tool for presenting information in a digestible format.
AI-Chat Usage per Wage Group
Anthropic found that the use of Claude peaks in occupations with high wages (upper 75% of all wages) – particularly Computer Programmers and Software Developers.
However, usage was low for both the highest-paying jobs (e.g., Obstetricians & gynecologists) and the lowest-wage group (e.g., Waiters) — supporting the idea that occupations involving human interactions have less AI usage.
How AI Is Used in UX
UX Tasks
I selected from the OPEC dataset a subset of 203 tasks that were within the realm of a UX or UX-adjacent professional. These corresponded to 18 different O*NET occupations, signaling broad categories of tasks that a UX or a UX-adjacent professional (such as a product manager or technical writer) may be doing. (See the sidebar to this article for the list of occupations and tasks.)
UX Compared with Other Professions
I found that, out of the one million Claude conversations, 7.5% were related to UX tasks.
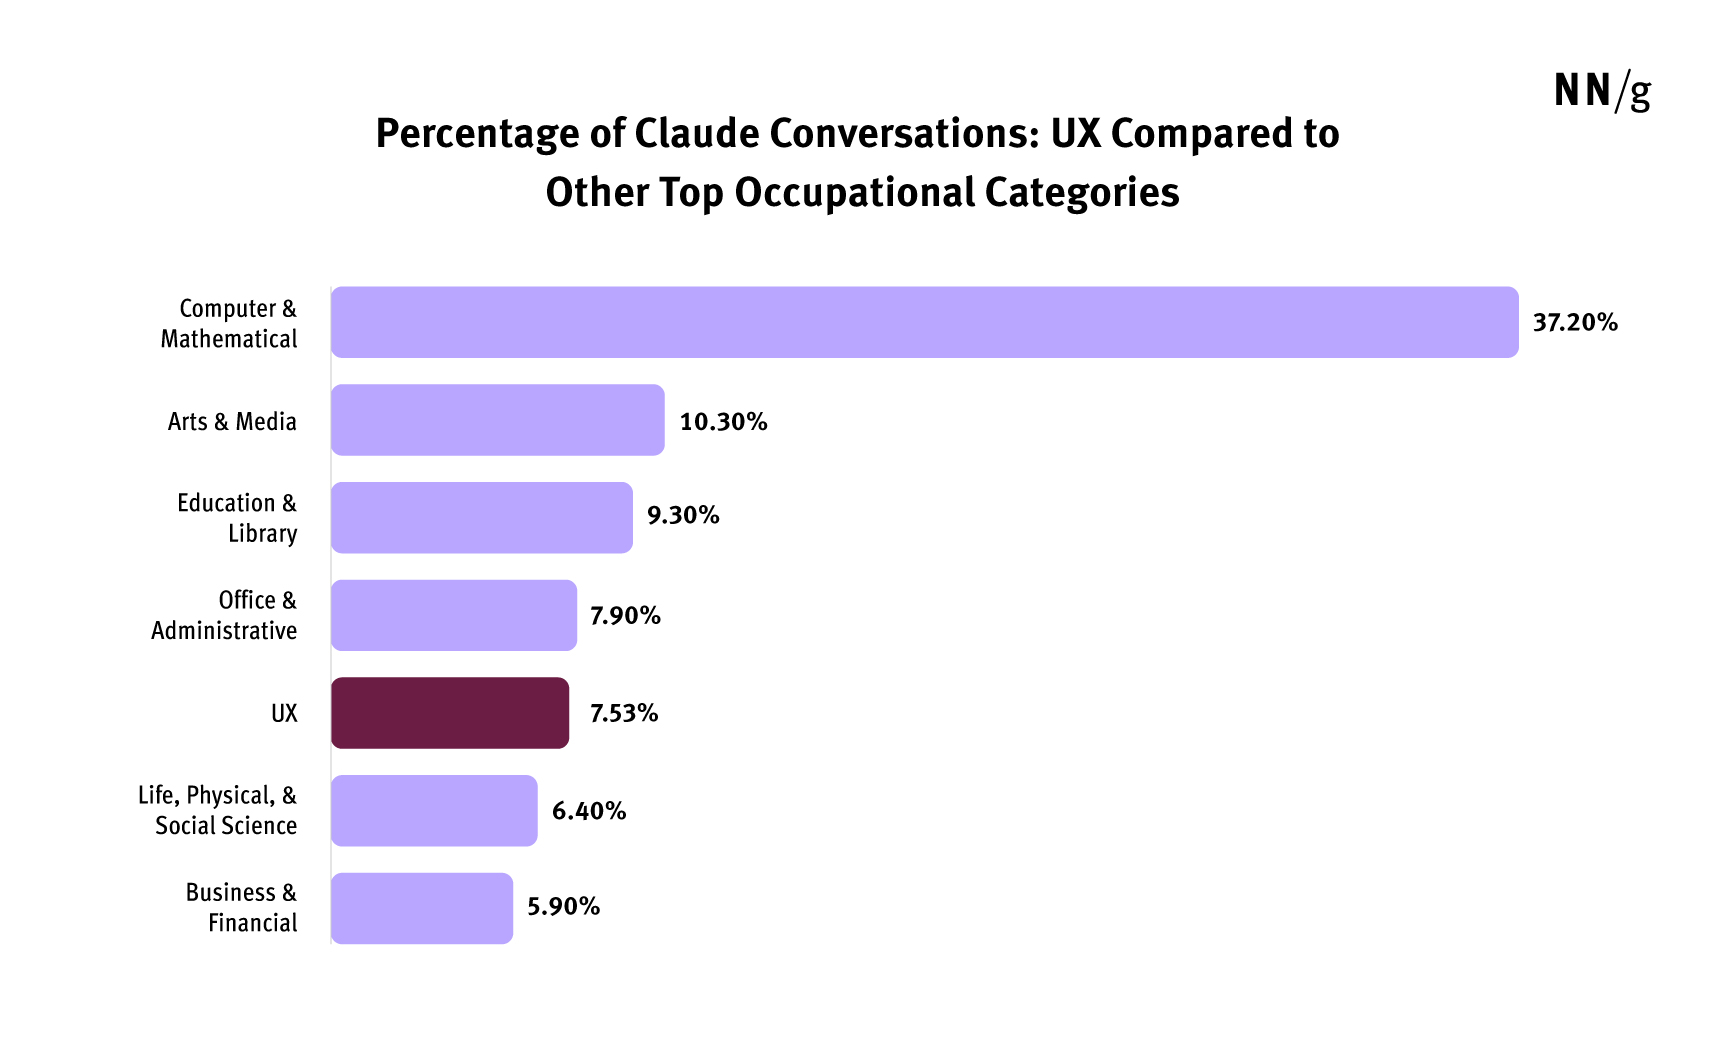
That is much lower than the 37.2% of conversations that were related to Computer & Mathematical tasks, but it is still among the top 5 areas.
(Note that many of the tasks that we ascribed to UX were categorized in these other top popular categories by Anthropic; if we were to subtract these from these categories, the corrected percentages for the top categories would be lower.)
The Size of UX in the Workforce
If AI generates 7.53% of the AI conversations, is it because there are lots of UX professionals in the US workforce? That is hardly the case. While it is difficult to pinpoint an exact figure, I estimate that UX professionals make up approximately 0.0012% of the US workforce.
(In 2023, software engineers made up 0.96% of the US workforce and, typically, for every 50 developers, there are 6 UX professionals — either designers or researchers. That means that the number of UX professionals represents 12% (6/50) of the number of software engineers, or about 0.0012% of the total US workforce. Note that this number does not include consultants or freelancers who work outside traditional organizations).
Nevertheless, the fact that 7.53% of the AI conversations were carried out by less than a hundredth of a percent of the overall workforce underscores the finding that UX is well represented among professions using AI chat.
Depth of AI Adoption in UX
Out of the total 203 tasks that were related to UX, 55% (111) had at least one conversation associated with them. That means that a little more than half of the UX tasks were attempted at least once with Claude. This puts UX firmly in the 94% percentile of all occupations — meaning that 94% of all occupations use AI for fewer tasks than UX.
Top UX Tasks with AI
For each UX task we looked at the percentage of Claude conversations associated with that task, as classified by Anthropic. Below we show the most popular tasks:
|
Percentage of AI conversations (n=1,000,000) |
|
|
Design, build, or maintain websites, using authoring or scripting languages, content creation tools, management tools, and digital media. |
1.19% |
|
Edit, standardize, or make changes to material prepared by other writers or establishment personnel. |
0.85% |
|
Edit or rewrite existing copy as necessary and submit copy for approval by supervisor. |
0.76% |
|
Organize material and complete writing assignments according to set standards regarding order, clarity, conciseness, style, and terminology. |
0.59% |
|
Write advertising copy for use by publication, broadcast, or internet media to promote the sale of goods and services. |
0.49% |
(Note that the percentages associated with these tasks are quite small, but, when considering the size of the conversation corpus, they amount to fairly large numbers. For example, 1.19% represents 11,900 Claude conversations.)
Top Occupational Areas for UX Tasks
Because UX is not listed as a category in the O*NET dataset, we can consider the original O*NET category as the area related to that UX task. For example, for the task edit, standardize, or make changes to material prepared by other writers or establishment personnel, the original occupational area was Technical Writing.
This classification helps us get a sense of the prevalence of different types of UX tasks.
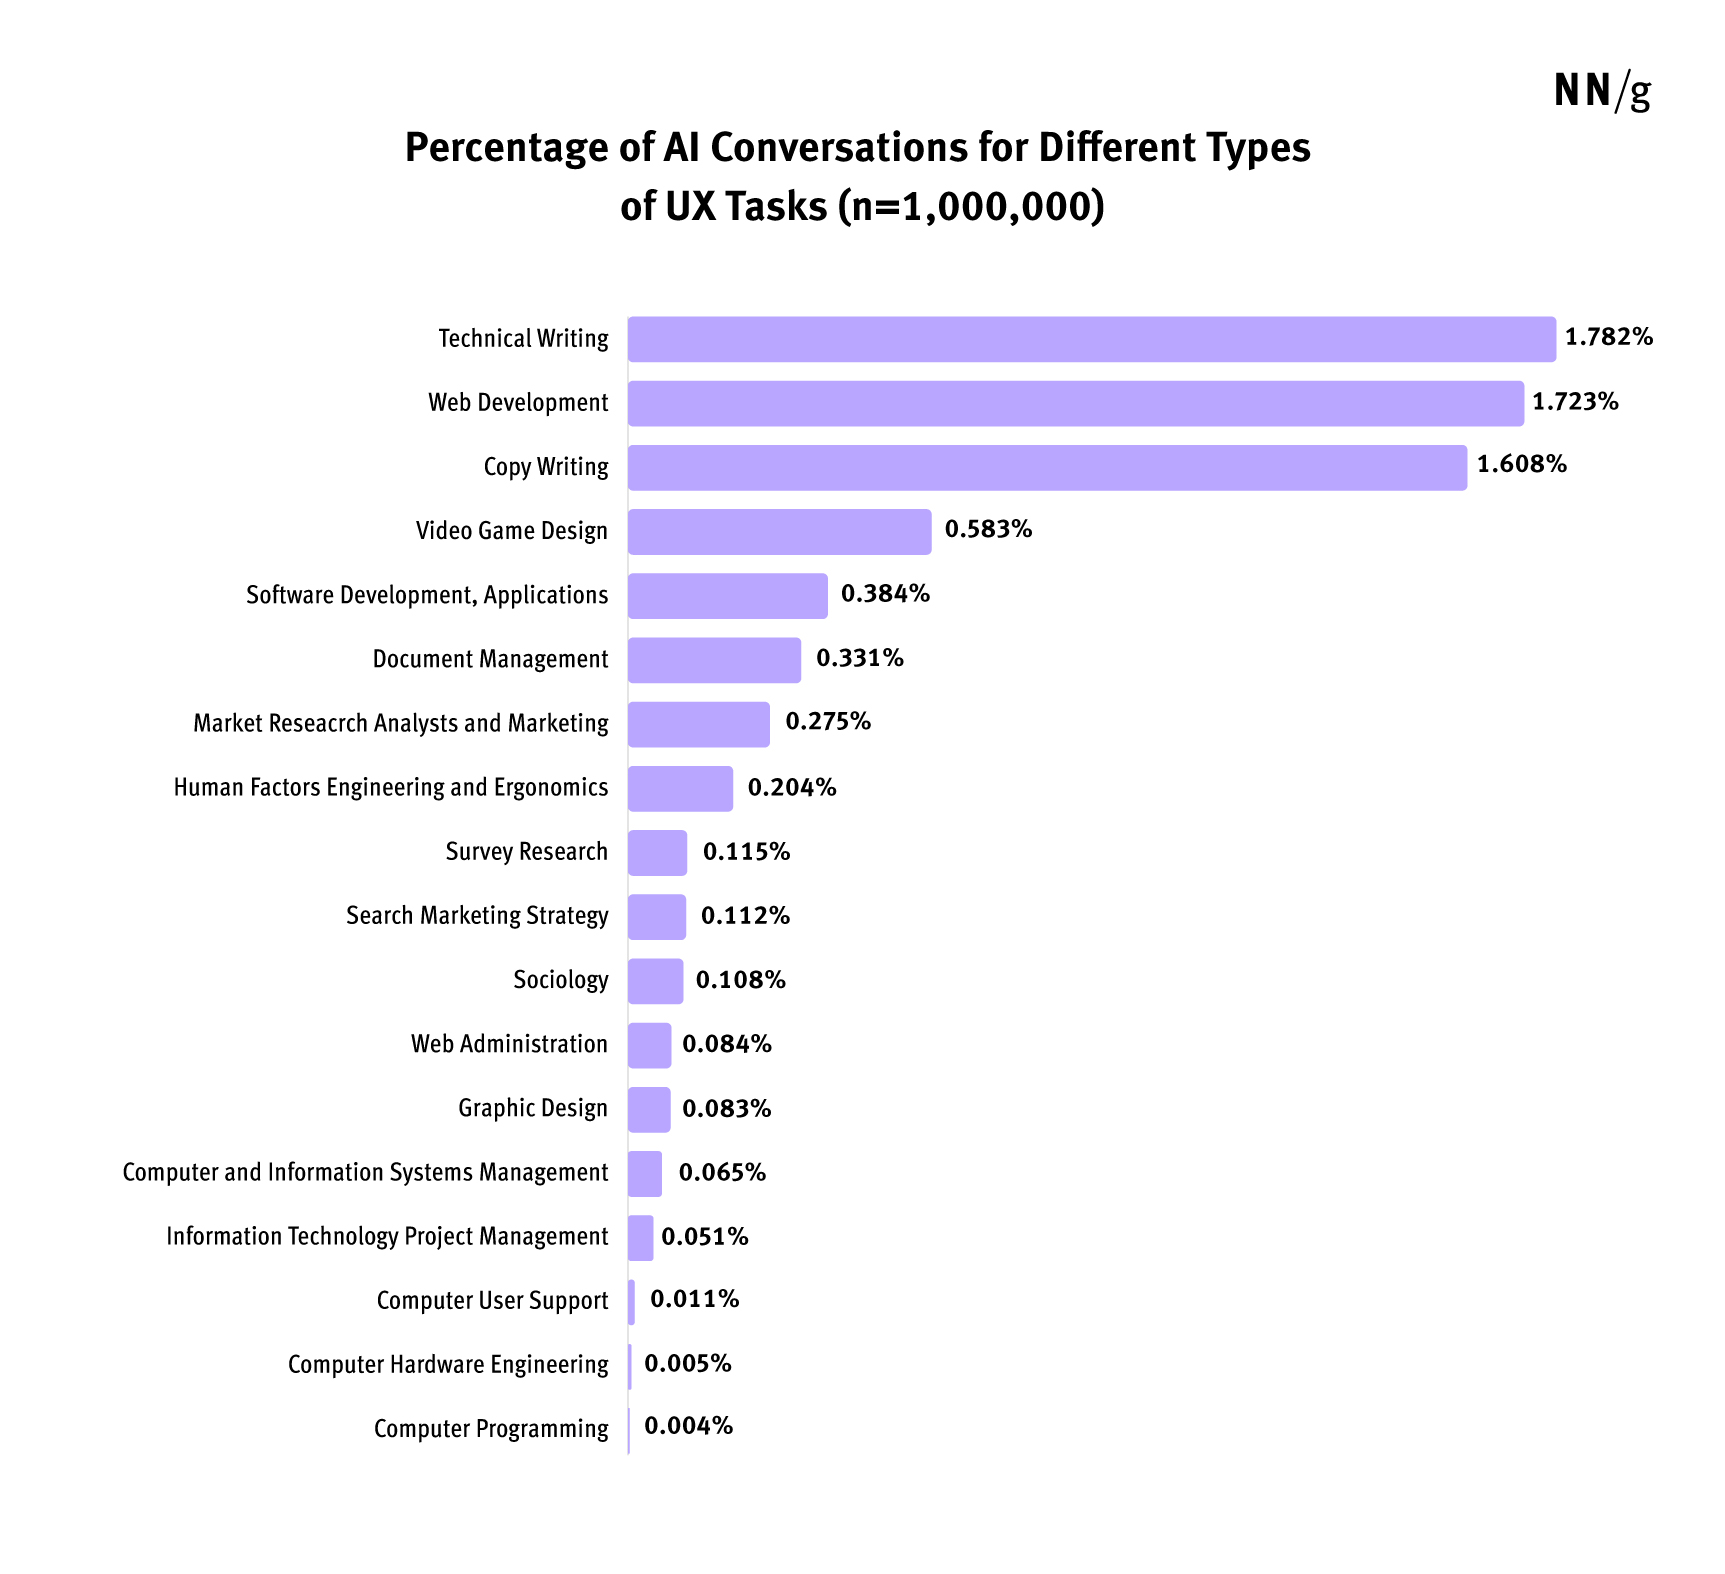
Most UX tasks performed with AI fell under the umbrella of Technical Writing, Web Development, and Copy Writing. This finding replicates the trend that writing and computer-related activities are most often attempted with AI.
In particular, the most popular UX tasks under the web development category were:
|
Percentage of AI conversations (n=1,000,000) |
|
|
Design, build, or maintain web sites, using authoring or scripting languages, content creation tools, management tools, and digital media. |
1.19% |
|
Write, design, or edit web page content, or direct others producing content. |
0.32% |
|
Develop web site maps, application models, image templates, or page templates that meet project goals, user needs, or industry standards. |
0.07% |
Tasks that fall under the traditional research umbrella are mostly the ones associated with the Human Factors Engineering & Ergonomics. Only 20% of these tasks were performed with Claude, suggesting that either UX professionals do not use AI for these tasks or that they may use other more specialized tools. The most popular type of conversation in this category was Investigate theoretical or conceptual issues, such as the human design considerations of lunar landers or habitats.
The categories that had the smallest percentages of UX tasks (Computer User Support, Computer Hardware Engineering, and Computer Programming) contributed only 4 UX tasks in total:
|
Percentage of AI conversations (n=1,000,000) |
|
|
Analyze user needs and recommend appropriate hardware. |
0.005% |
|
Write or contribute to instructions or manuals to guide end users. |
0.004% |
|
Prepare evaluations of software or hardware, and recommend improvements or upgrades. |
0.006% |
|
Confer with staff, users, and management to establish requirements for new systems or modifications. |
0.005% |
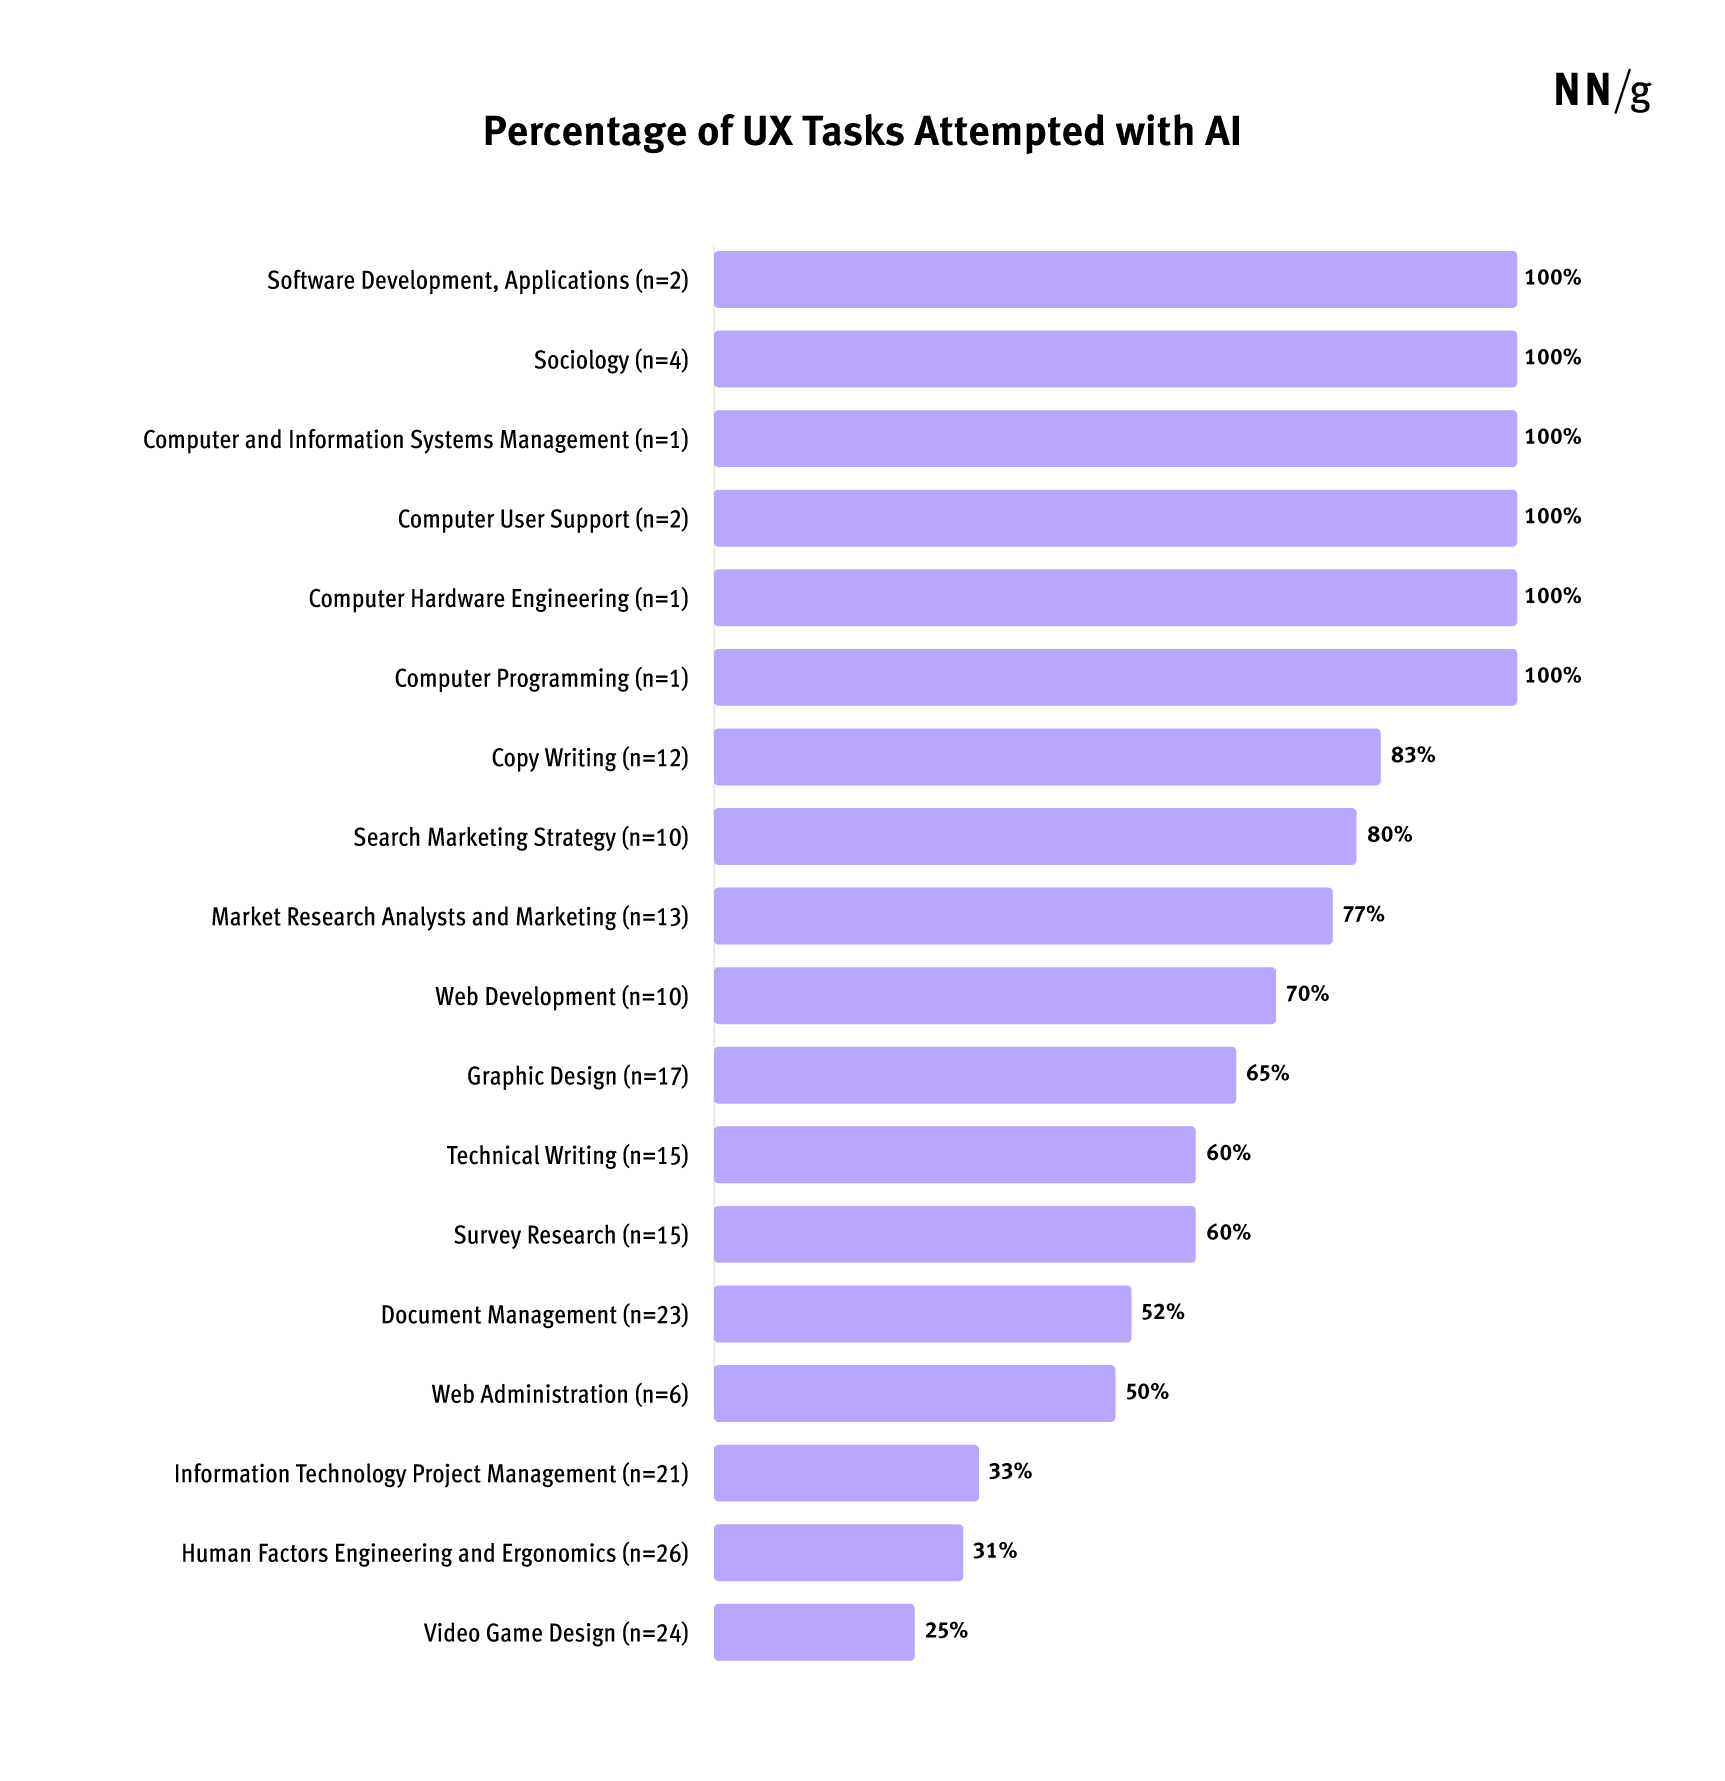
Technical Writing had 60% of the UX tasks attempted in at least one Claude conversation. The most popular tasks was edit, standardize, or make changes to material prepared by other writers or establishment personnel.
Depth of AI Adoption in UX
The areas at the top had few tasks, so it’s less surprising that they were all attempted with UX. Among the areas with more than 10 tasks, Copy Writing, Search marketing strategy, and Market Research Analysis and Marketing had the highest adoption, at above 77%. Human Factors and Engineering and Ergonomics and Video Game Design had the lowest adoption.
Tasks with No AI Conversations
When considering the UX tasks that were not attempted, remember that this doesn’t mean UX professionals weren’t using AI at all for those tasks — just that they were not using Claude. Especially for activities like conducting interviews or generating prototypes, UX professionals might be more likely to use specialized AI tools built for that specific purpose.
Out of the 92 tasks that had no Claude conversations:
- 14% (13) activities involved some type of user-interaction activity
- Conduct interviews or surveys of users or customers to collect information on topics such as requirements, needs, fatigue, ergonomics
- Collect data through direct observation of work activities or witnessing the conduct of tests
- 28% (26) activities had another type of human-interaction component (usually involving interaction with coworkers or clients).
- 20% (19) activities involved complex analyses (conduct regular design reviews throughout the game development process; assess the user-interface or usability characteristics of products)
- 13% (12) activities involved graphics or prototyping (e.g., prepare electronic commerce designs or prototypes, such as storyboards, mock-ups, or other content, using graphics design software).
In addition to the existence of alternative, specialized AI tools, there could be more reasons why some tasks had no Claude conversations:
- They cannot be carried out (at this point) with any AI tool. For example, a task like monitor the performance of project team members, providing and documenting performance feedback may be difficult to do with an AI. It could be that at least some parts of the task could, eventually, be accomplished using AI or the task may evolve in a way that makes it possible to accomplish it with AI (in the same way in which many UX workshops were initially thought to be impossible to do remotely).
- The tasks are too complex and require too much effort to explain it to an AI. Still, it could be the case that certain components may be achievable with AI.
- The tasks are obsolete and no longer done (e.g., develop negatives and prints to produce layout photographs, using negative and print developing equipment and tools).
How Will AI Change the UX Workforce?
Currently, AI chat use is heavily concentrated in digitally oriented professions, which account for just 30% of the workforce. UX professionals, though representing less than 0.01% of workers, generate a remarkable 7.5% of AI conversations.
As AI becomes more prevalent, tracking these trends will reveal how job representation evolves. Will these digitally focused roles shrink as AI takes over tasks? And how will their wages shift, as AI reshapes these roles: will the people remaining in these professions hold on to valuable expertise, guiding and optimizing AI-driven processes and thus become even better paid? Or, due to the high supply of workers in digital-facing areas, will wages decrease and expertise become less valuable?
As AI takes over UX digital activities, UXers will increasingly need to concentrate on tasks inherently suited to human strengths and emphasize deep empathy-driven user research, stakeholder collaboration, and complex strategic decision making.
Human UX specialists will still need to interpret nuanced human behavior and ensure that AI-generated outputs align meaningfully with human needs. Ultimately, the human touch will remain indispensable, reinforcing that UX fundamentally revolves around people.
Limitations of This Research
- It’s not clear whether people using Claude are representative of the whole population of AI users. Also, people may be using other tools or specialized AI software for certain tasks.
- We don’t know the success rates for these tasks, so just having attempted them does not actually speak as to whether it’s reasonable to expect them to be completed with AI.
- We don’t know whether the conversations were correctly classified by Anthropic’s Claude-based classification software.
- The O*NET database did not have an occupation that directly corresponded to UX, but it did have occupations that were related (e.g., Human Factors and Ergonomics Engineer, Graphic Designer, Information Technology Project Manager) as well as occupations that had some tasks commonly carried out by a UX professional.
References
Kunal Handa , Alex Tamkin, Miles McCain, Saffron Huang, Esin Durmus Sarah Heck, Jared Mueller, Jerry Hong, Stuart Ritchie, Tim Belonax, Kevin K. Troy, Dario Amodei, Jared Kaplan, Jack Clark, Deep Ganguli. Which Economic Tasks Are Performed with AI? Evidence from Millions of Claude Conversations. (February 2025). Retrieved on March 11, 2025 from https://assets.anthropic.com/m/2e23255f1e84ca97/original/Economic_Tasks_AI_Paper.pdf