Measuring checkout efficiency is crucial for every eCommerce website, as it directly impacts business success. In this article, I will share key metrics that help understand checkout performance and provide actionable insights, enabling designers to enhance the checkout process and optimize the user experience.
Overall Checkout Completion Rate
The overall checkout completion rate is a key metric in eCommerce, representing the percentage of customers who successfully complete the checkout process out of all those who initiated it. This metric is essential for evaluating the performance and health of your checkout flow.
Worth noting that while the checkout completion rate is influenced by the quality of the checkout experience, it is also affected by various factors higher up in the funnel. However, by monitoring fluctuations in the checkout completion rate, you can better understand the impact of your adjustments and continuously refine the customer journey.
Completion Rate Per Step
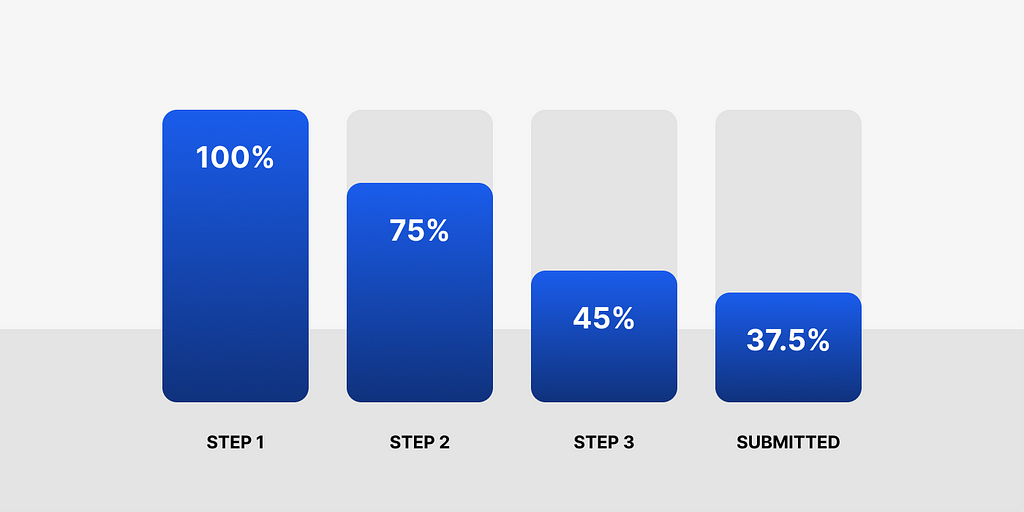
If you have a multi-step checkout flow, it’s helpful to track the completion rate for each step individually. Even in a single-step checkout, there are often multiple segments where users provide information, such as shipping address and payment details. Monitoring the completion rate per step helps you identify the specific stages where customers abandon the process, allowing you to address and resolve each potential issue separately.
Error Rates
During the checkout process, buyers may encounter various errors that can hinder their progress. These errors can be categorized into three groups:
- Field validation errors,
- Payment processing errors,
- Misc backend errors.
By monitoring these error rates, you can pinpoint the exact stages where errors occur, allowing you to make targeted improvements to the checkout experience.
Other Metrics That Are Worth Tracking
Here are additional data points that can provide valuable insights into your checkout process:
Payment Methods Usage Rate
Understanding which payment methods are the most popular among your customers allows you to prioritize these options. Focusing on optimizing the experience and minimizing errors for these preferred methods can significantly enhance checkout efficiency.
Shipping Methods Usage Rate
Analyzing the usage rate of shipping methods helps you understand your customers’ preferences, such as whether they prioritize speed over cost. This insight can guide you in optimizing your shipping options to better meet user needs.
Promo Code Applicability
Tracking how often promo codes are applied can reveal the effectiveness of your promotional strategies and highlight potential areas for improvement in the checkout process.
Average Number of Items in Checkout
Knowing the average number of items customers have in their checkout can influence the design and layout of your checkout page. This information can help you create a more streamlined and user-friendly experience.
Segmenting Your Data
While the data mentioned above is valuable on its own, segmenting it can provide even deeper insights and accuracy. Below I will list a few segments to consider.
Device Type
Users’ behavior can vary significantly between desktop and mobile devices. Segmenting by device type allows you to understand and optimize the checkout experience for each cohort, catering to their specific needs and behaviors.
Geographical Region
Users from different geographical regions may have different patterns or preferences for payment and shipping methods. Segmenting by geography can help you tailor the checkout process to meet the specific expectations and requirements of users in different locations.
User Type
New and returning customers often behave differently. Returning customers may have saved shipping addresses and payment methods, making their checkout process smoother. In contrast, new users rely more on their previous experiences with other eCommerce platforms. Tracking how experiments and updates affect both new and returning customers can provide valuable insights.
With all this data at your disposal, you’ll gain a wealth of insights that can drive significant improvements in your checkout metrics and overall business performance.
Do you find any other metrics helpful? Please share in the comments below!
![]()
Key Metrics for Designers to Track in the Checkout was originally published in UX Planet on Medium, where people are continuing the conversation by highlighting and responding to this story.