In this article, we’ll look into Google’s Web Vitals initiative and the three Core Web Vital metrics. I’ll show you how they measure web performance, summarize their pros and cons, and explain how you can optimize your website for them.


Core Web Vitals are Google’s core metrics to quantify the overall vitality of a web page from the user’s perspective. They are also included in Google’s search engine algorithm, therefore they affect the SEO rankings of any website.
The Core Web Vital metrics describe the user experience of a web page in three numeric values:
- Largest Contentful Paint (LCP) measures loading performance
- First Input Delay (FID) measures interactivity
- Cumulative Layout Shift (CLS) measures visual stability
The ultimate goals of Core Web Vitals are to make the web load faster, improve the user experience during page loads and user actions, incentivize developers to diagnose and fix web performance issues, and support users with low-end devices or on slow networks to access web content more easily.
Let’s start by working out exactly what Core Web Vitals are.
Jump to sections in this article:
What Are Core Web Vitals, in Detail?
Core Web Vitals are a subset of Google’s Web Vital signals that measure website health, a.k.a. vitality, from the aspect of user experience.
Most Web Vitals quantify the timing of subsequent events happening on a web page during its lifespan, from the appearance of the first byte on the screen until the user leaves the page. The only exception is Cumulative Layout Shift, which is not a time value — instead, it quantifies the visual stability of a web page using a unitless value.
Each Web Vital describes and evaluates a different event (or group of events), so together, they provide a holistic view of how smoothly users can access and interact with content on a page.


Web Vitals can be grouped into two categories:
- Core Web Vitals, which are part of Google’s Page Experience report and included in the search algorithm, therefore they are ranking factors.
- Other Web Vitals, which are not part of the Page Experience report and not included in the search algorithm, therefore they are not ranking factors. However, they can still help with diagnosing web performance issues, improving page load times, and — as Web Vitals are related to each other — understanding the reasons behind Core Web Vital results.
tip
Improving web performance is not only important because of SEO, but faster websites also have lower bounce rates, a higher conversion rate, better user engagement, a lower cart abandonment rate (in the case of eCommerce sites), etc.
Optimizing your website for the Page Experience report is an essential part of technical SEO. As defined in the documentation of Google Search Central:
“Page experience is a set of signals that measure how users perceive the experience of interacting with a web page beyond its pure information value, both on mobile and desktop devices.”
In total, Google’s Page Experience report includes the following search signals:
The Page Experience update was fully rolled out in August 2021. In the updated search algorithm, Core Web Vitals have replaced AMP (Accelerated Mobile Pages), Google’s previous web performance initiative.
info
A Summary of Web Vitals
Before we look into how Web Vitals are measured and evaluated, here’s a summary of Google’s all Web Vitals and their most important features (we’ll discuss all of these characteristics later in the article):
|
Shortform
|
Is it a Core Web Vital?
|
Lab or field metric?
|
Passing threshold
|
Failing threshold
|
Docs
|
|
|
Largest Contentful Paint
|
LCP
|
yes
|
both
|
2.5 sec
|
4.0 sec | See LCP |
|
First Input Delay
|
FID
|
yes
|
field
|
100 millisec
|
300 millisec | See FID |
|
Cumulative Layout Shift
|
CLS
|
yes
|
both
|
0.1
|
0.25 | See CLS |
|
Interaction to Next Paint
|
INP
|
pending
|
both
|
200 millisec | 500 millisec | See INP |
|
Time To First Byte
|
TTFB
|
no
|
both
|
800 millisec
|
1800 millisec | See TTFB |
|
First Contentful Paint
|
FCP
|
no
|
both
|
1.8 sec | 3.0 sec | See FCP |
|
Total Blocking Time
|
TBT
|
no
|
lab
|
not applicable | not applicable | See TBT |
|
Time To Interactive
|
TTI
|
no
|
lab
|
not applicable | not applicable | See TTI |
Lab Metrics vs. Field Metrics
There are two ways to collect Web Vitals (or any other performance-related) data:
- In the lab: You run synthetic tests either in your own browser (with a browser extension such as Lighthouse) or using a synthetic monitoring tool, such as Pingdom, GTmetrix, DebugBear, etc., that runs automated, pre-configured tests from remote locations.
- In the field: You either monitor the behavior of your real website visitors using a real user monitoring (RUM) tool, such as Raygun, New Relic, Dynatrace, etc., or analyze Google’s own RUM data that it collects on consenting Chrome users and publishes in the Chrome User Experience Report.
As you can see in the comparison table above, Web Vitals can be grouped as:
- Lab (theoretical or abstract) metrics: They are only measurable in a synthetic lab environment but not on real users. Here, the results are reproducible because you run the tests in a controlled environment with pre-set device and network configurations.
- Field (practical or applied) metrics: They are only measurable on real users but not in a controlled synthetic environment. As the metrics are the aggregation of real-world data gathered from user sessions that only happen once, the results are not reproducible.
- Hybrid metrics: They are measurable both on real users and in a synthetic environment (however, the two types of measurement return different results).
👉 Check out Google’s own definition of lab vs field data in the official web.dev docs.
info
Only field-measurable metrics are included in Google’s search engine algorithm because lab-only metrics don’t have the ability to measure real user sessions. So while other field metrics may be added to Core Web Vitals in the future, e.g. INP will replace FID in March 2024, it’s not likely that lab-only metrics (TBT and TTI) will ever be part of the algorithm (unless Google completely changes its approach to user experience, e.g. will think that simulated user sessions are more important than real ones).
Target Thresholds for Field Metrics
A target threshold defines a minimum value that a given ratio of all data points needs to pass. In the world of Web Vitals, target thresholds are only applicable to field metrics because these are aggregated metrics that include multiple real user sessions.
As defined in the specs, the value of a field-measured Web Vital is equal to the 75th percentile, also known as the third/upper quartile, value of all the evaluated user sessions — instead of the average or median value.
info
To make it easier to interpret Web Vitals, Google defines two target thresholds for each field-measurable metric:
- a passing threshold: if the 75th percentile value of all measured user sessions is equal to or higher than the passing threshold, your web page will be marked as “good” (green 🟩)
- a failing threshold: if the 75th percentile value of all measured user sessions is lower than the failing threshold, your web page will be marked as “poor” (red 🟥)
The yellow 🟨, or “needs improvement”, category means that the 75th percentile value is between the two thresholds.
On the image below, you can see the target thresholds for the three Core Web Vitals:
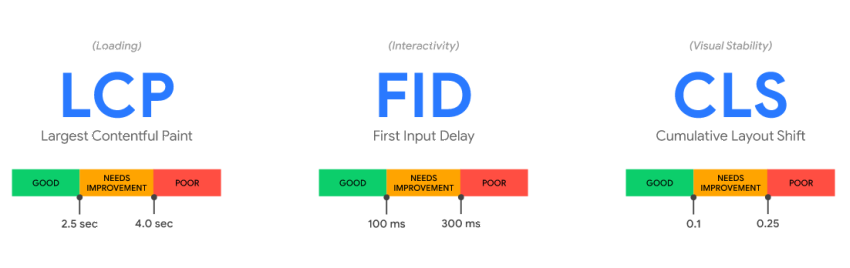
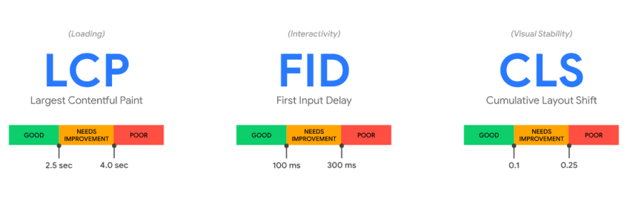

To pass Google’s Core Web Vitals test, you need to score green 🟩 for all the three metrics. The scores are re-calculated every day, based on the data of the latest 28 days (however, note that some Core Web Vitals monitoring tools, such as CrUX on BigQuery, only give you access to monthly data).
Also note that Google measures desktop and mobile results separately — so you’ll have two sets of Core Web Vital scores:
- To rank well in mobile search, your mobile scores are taken into account.
- To rank well in desktop search, your desktop scores matter.
For example, here are the desktop results of our main page (webdesign.tutsplus.com) from Google’s PageSpeed Insights tool:

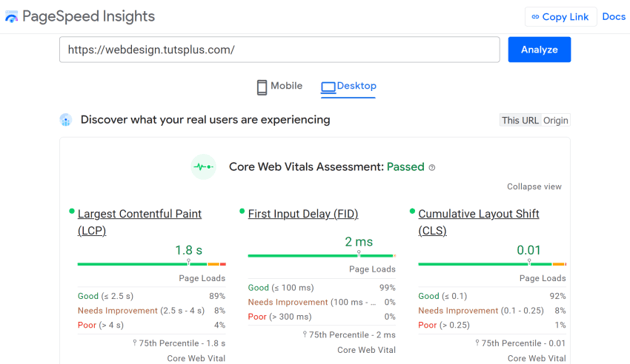

In addition to the 75th percentile values (e.g. 1.8 s for LCP), PageSpeed Insights also shows the ratio of all measured user sessions that:
- 🟩 passed the green threshold: e.g. 89% for LCP
- 🟨 were between the two thresholds and scored yellow: e.g. 8% for LCP
- 🟥 and fell below the red one: e.g. 4% for LCP
For reference, here are the desktop results of a web page (not from our website) that scored red for LCP and CLS:
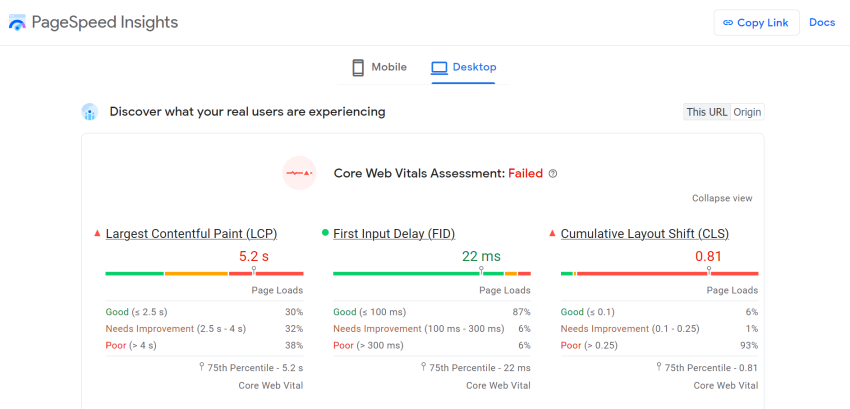
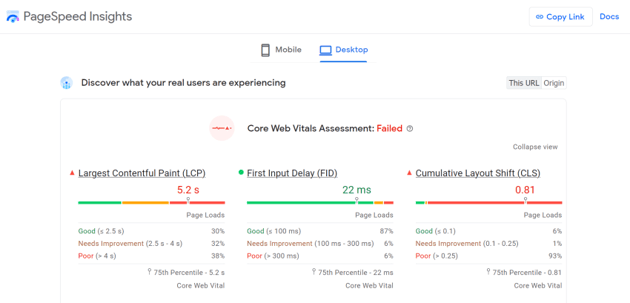
👉 See how Google defines the Core Web Vitals thresholds on the web.dev site.
The Three Core Web Vitals: Definitions + Brief Recommendations
Now, let’s see the three Core Web Vitals one by one.
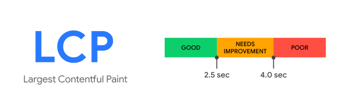
1. Largest Contentful Paint (LCP): How Fast Does Your Largest Visible Content Element Fully Appear in the User’s Browser?
Largest Contentful Paint measures the render time of the largest content element that’s visible above the fold. This can be either an image or a text block such as a heading.
LCP can be measured both in the lab and the field. The passing threshold is at 2.5 seconds while the failing threshold is at 4.0 sec:


There are many ways to improve your LCP scores, such as:
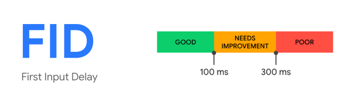
2. First Input Delay (FID): How Fast Does the Browser Process the First User Action?
First Input Delay measures the time difference between when the user makes their first interaction with the page (e.g. clicks a button) and when the browser starts processing the belonging event handlers.
As FID quantifies the actions of real users, it’s only measurable in the field. However, it correlates well with a lab-only metric: Total Blocking Time (TBT) which measures interactivity in a simulated environment. So if you want to understand the reasons behind poor FID scores, you can analyze your TBT results with a lab tool such as Lighthouse.
The passing threshold for First Input Delay is at 100 milliseconds while the failing threshold is at 300 millisec:


For most websites, FID is the easiest Core Web Vital to score well for, but you can still improve it by using web performance best practices such as:
- minifying CSS and JavaScript files
- removing unused code from stylesheets and scripts
- reducing the impact of third-party JavaScript code
- deferring non-critical scripts and offscreen images
- splitting up long-running tasks
- … and more
Because FID only measures the first user action and almost every website passes it, Google decided to replace it with Interaction to Next Paint (INP). INP assesses the overall responsiveness of a page by finding the longest user action over its lifespan. The change will take place in March 2024 when FID will become a regular Web Vital and won’t be included in the search algorithm anymore. However, as both FID and INP measure interactivity, FID optimization techniques will still help with scoring better for INP — even though INP optimization will also take extra steps as it’s a more holistic metric.
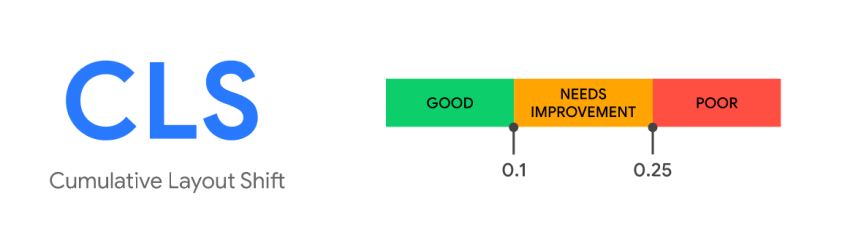
3. Cumulative Layout Shift (CLS): How Much Instability Does the Largest Unexpected Burst of Layout Shifts Cause?
Cumulative Layout Shift is the only Core Web Vital that’s not a time value. Instead, it quantifies the visual instability caused by the largest burst of unexpected layout shifts over the lifespan of a page. Think of things such as ads, banners, or embeds suddenly appearing out of nowhere and pushing the adjacent elements down, up, or aside.
tip
CLS only includes unexpected layout shifts (as only these cause a bad experience for the user). There are also good layout shifts that the user does expect, such as user-initiated layout shifts, subtle animations and transitions, and others; see what the difference is between expected and unexpected layout shifts according to Google.
As visual instability is hard to quantify, CLS has a unitless value, which is the product of the impact fraction and distance fraction. It can be measured both in the lab and the field. The passing threshold is at 0.1 while the failing threshold is at 0.25:


You can improve your Cumulative Layout Shift scores if you reduce unexpected movement on the page by following best practices such as:
- adding the
widthandheightattributes to images in HTML - creating accessible animations
- limiting the number of custom fonts you use, as loading these fonts can result in unexpected layout shifts
- reserving vertical space for late-loading content, such as ads and banners, using the
min-heightCSS property - avoiding adding many slow-loading widgets to your page
- … and more
The Pros and Cons of Core Web Vitals
Before wrapping up this post, let’s see some pros and cons of Core Web Vitals and the Web Vitals initiative:
Pros
- Web Vitals provide a new approach to measuring web performance. Rather than purely measuring the time needed for a full page load, they provide a more holistic evaluation of user experience that makes troubleshooting easier.
- There are many tools available to measure and track Core Web Vitals — both Google’s own tools and third-party applications.
- Google doesn’t force its own library and syntax onto website owners and doesn’t redirect your site to its own domain like it used to do with Google AMP.
- Thanks to the traffic light 🟥🟨🟩 notation, the results are visually descriptive and easy to understand for everyone.
- Core Web Vitals discourage the use of user-hostile UX design patterns, such as auto-playing carousels, unstoppable animated GIFs, and others.
Cons
- There’s a risk that developers will only focus on the three Core Web Vitals and overlook other important aspects of web performance and user experience.
- The official docs on the web.dev site are hard to navigate, poorly structured, missing critical information, and confusing at places.
- While Core Web Vitals are more flexible than Google’s previous web performance initiatives, it still enforces its own view of user experience, which may differ across niches and audiences (e.g. which layout shift is seen as “unexpected”). This can restrict creativity and experimentation with certain types of designs.
Wrapping Up
In this article, we looked into Google’s Web Vitals initiative and its web performance metrics. As Core Web Vitals are now ranking factors, monitoring them and optimizing web pages for better scores have become an essential web development task.
However, Core Web Vitals are not solely about improving SEO rankings. As Web Vitals together measure the overall health and vitality of a website, improving your scores also leads to better website hygiene, which has other advantages as well, such as less technical debt, fewer errors, higher user engagement, better business metrics (conversion rate, bounce rate, cart abandonment rate, etc.), and (sometimes but not always) lower running costs.
On the negative side, the Core Web Vitals metrics are not yet perfect, First Input Delay will be replaced with Interaction to Next Paint, which is still in its early stages, the calculation method of Cumulative Layout Shift keeps changing, and Google is developing a completely new, AI-based search engine (no timeline yet) which may or may not include these metrics.
Whatever the future holds, good website health and performance-focused web development will keep being a competitive advantage, and optimizing your pages for Core Web Vitals is a good place to start.