It goes without saying that building web applications requires a lot of work. Not only do you have to design, debug, and deliver a fast server-side application, but the same amount of time and care must go into designing, debugging, and delivering a fast client-side application. This means that everyone involved throughout the development process needs to work together to ensure their applications operate at top performance.
Of course, there are plenty of performance-oriented development tools that developers can use to ensure their client-side code is as fast as possible, but the data gathered by those tools are theoretical at best. Only after an application is launched and used by real users can you get a true picture of the application’s performance. That’s why you and your team need Raygun Real User Monitoring.
Raygun Real User Monitoring provides front-end web performance monitoring for web, mobile, and desktop applications. It enables you to measure and analyze how your software performs for real users. If you’re skeptical, don’t be. Raygun has several years of experience monitoring application performance, providing world-class tools that developers rely on for finding and analyzing errors and performance issues.
Tracking Your Application’s Performance
After incorporating Real User Monitoring into your application, a process as simple as including two script elements in your application’s template, the service starts receiving data on your user’s experience—the pages/views they visit, the assets downloaded for those pages/views, the amount of time it took for them to transfer and render, and information about the user itself.
On the main dashboard page, you’re greeted with the application’s generalized performance.
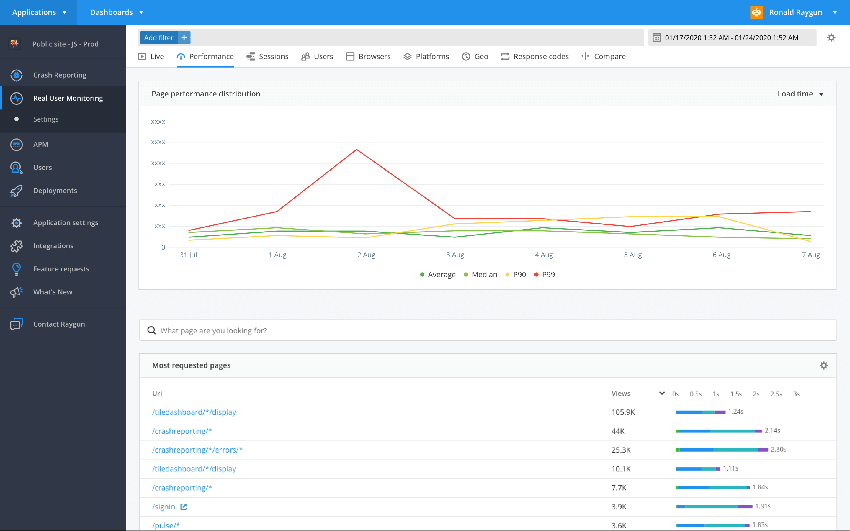
The main graph visualizes the overall performance of your application, detailing the average, median, 90th percentile and 99th percentile for the following metrics of your app’s performance:
- First Paint—the time between navigation and when the browser renders the first pixels to the screen.
- First Contentful Paint—the browser renders the first bit of content.
- Load Time—the time it takes for the entire page to load.
From there, you’re given a list of the pages your users frequent the most. This is extremely important information, as it gives you the pages/views you should focus on the most. Yes, all pages are important, but let’s be real—some are more important than others.
On the dashboard, you’re given a quick visualization of the most requested pages’ load times.
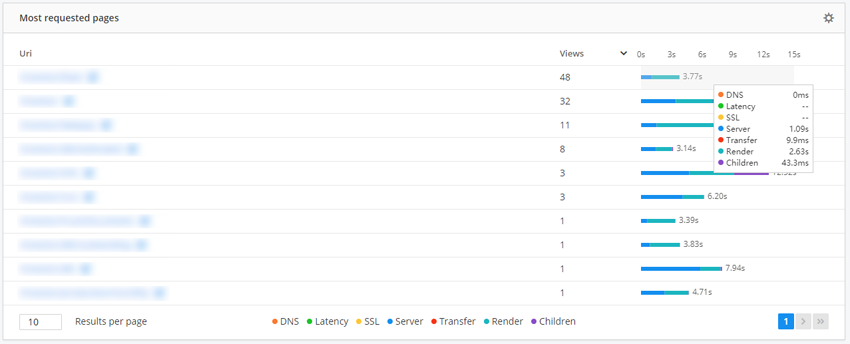
A single page’s load time is broken up into several values:
- DNS lookups
- Latency—the time for the host to receive, process, and respond
- SSL handshake time
- Server—the time it takes for the server to process. This also ties into Raygun Application Performance Monitoring (APM), so that you can get a detailed look at what code processed the request.
- Transfer—the time the page has to wait for assets to download
- Render
- Children—the time for asynchronous assets to process
Naturally, this is a lot of information to cram into such a small graph, so Real User Monitoring lets you drill into each individual page and view detailed information about the page’s performance.
Right off the bat, Real User Monitoring gives you a histogram that details the performance distribution of the page. With it, you can easily see how well the page performed for all your users.
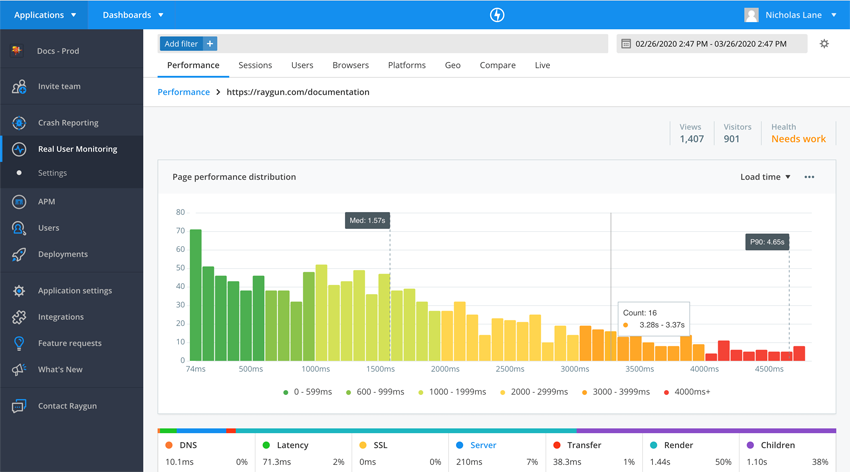
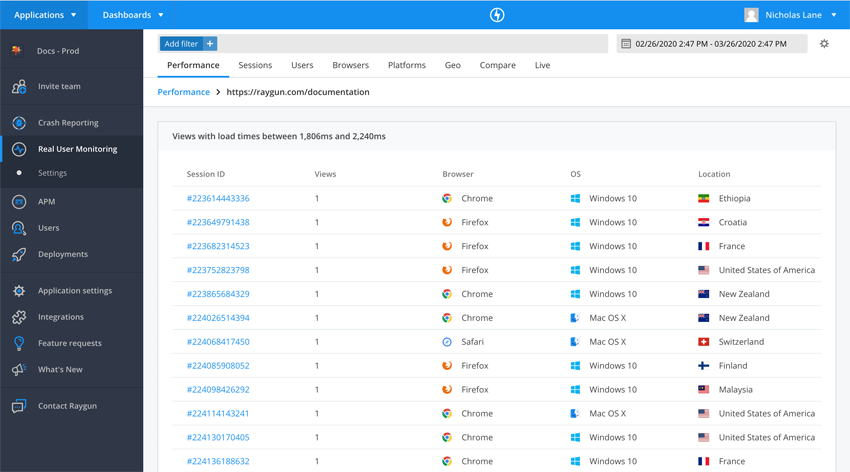
One of the best features of this view is the histogram itself. Clicking on any of the bars gives you a detailed look at the individual user sessions that visited the page for that time frame. From here, you can easily identify user trends: the browser and OS they use, as well as their general location sourced by the session’s IP. You also gain access to an individual user’s journey through your application (more on that later).
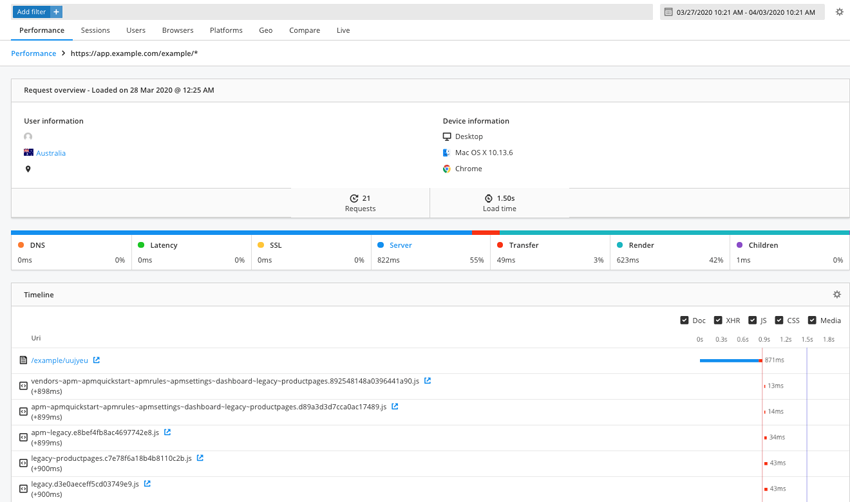
Real User Monitoring also lists all of the downloaded assets (and their corresponding load time values) for an individual page, and it catalogs XHR requests and their load-time performance information.
The overall performance is just part of the picture Real User Monitoring gives you; you can also view your users’ independent sessions!
Viewing Sessions
Real User Monitoring lets you understand exactly how your application performed for every user, giving you detailed diagnostics for every page request using a waterfall chart. In short, you can retrace a user’s journey through your application.
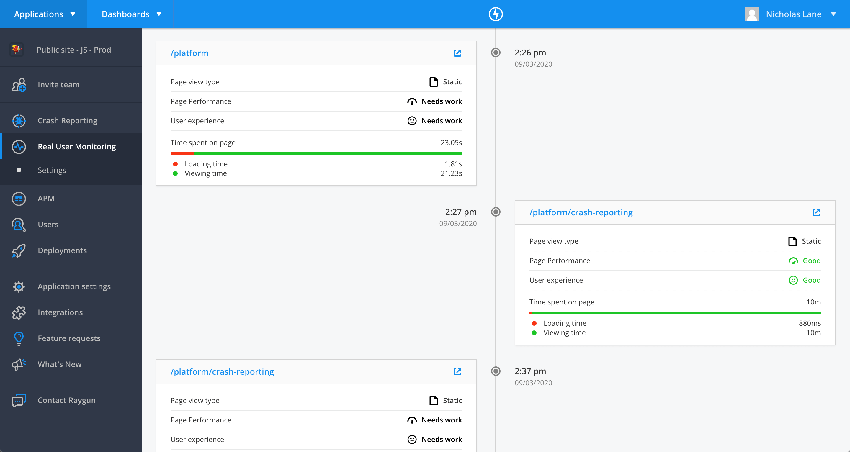
This is truly amazing, as it gives you a detailed view of how your users experience your application. Not only do you learn how a user visited your application (e.g. browser, OS, and device), but each step through the journey provides detailed information about how the user experienced the page. This is instance-level data! You get to see how an individual page, and its assets, loaded for an individual user for an individual page visit.
While a user’s experience is vital to understanding the performance of your application, sometimes you need a broader picture, focusing on browsers and platforms. Real User Monitoring has got you covered.
System Stats
In a perfect world, the browser and/or operating system someone uses would not affect how an application performs, but we all know that browsers and operating systems behave differently and affect performance accordingly. That is why Real User Monitoring gives you detailed, performance-driven information on your users’ systems.
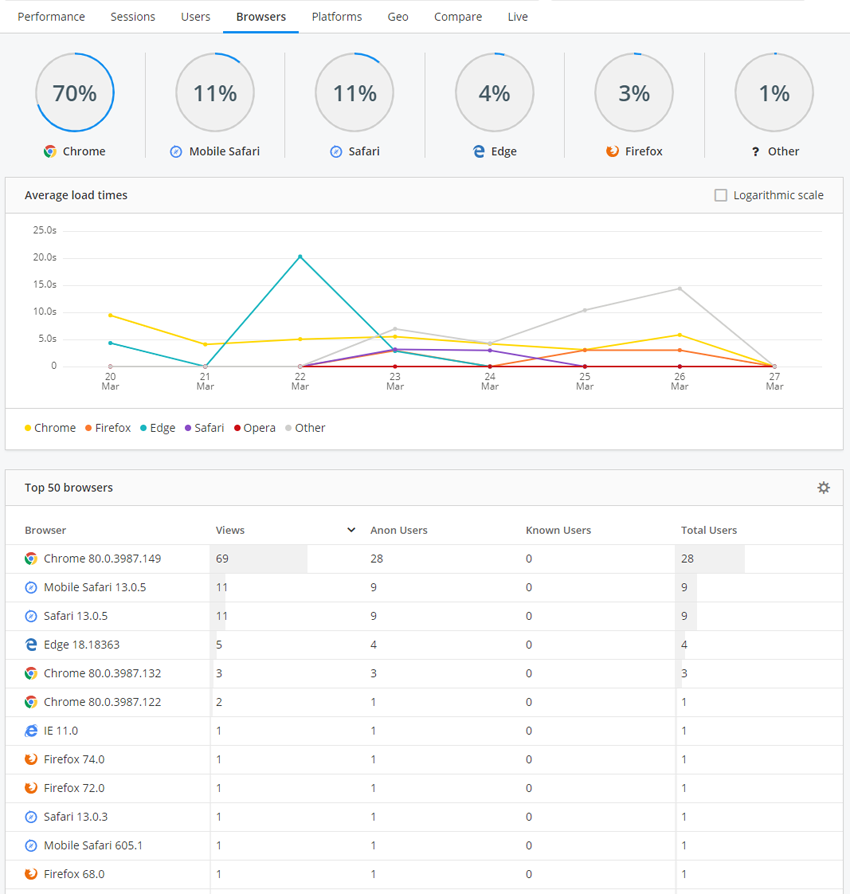
Not only do you get a better picture of what systems your users use, but you are given average load times for each browser and operating system. You’ll easily be able to spot performance issues with certain browser versions, giving you insight into which browsers you need to target and test more.
Comparing Data
One of the more interesting aspects of Real User Monitoring is the ability to compare different averaged dimensions. For example, do you want to see the difference in performance between Windows 10 and macOS, or between Chrome and Firefox? You can!
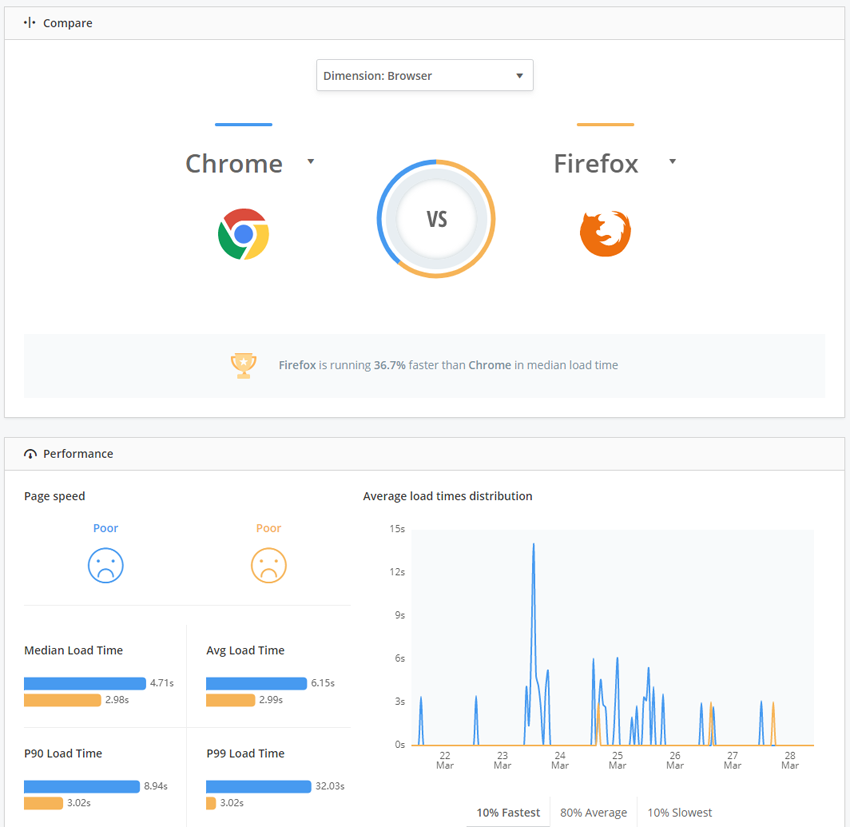
But OS is just one dimension; you can compare stats between browsers, devices, cities, states, countries, and different versions of your application. The latter dimension is extremely useful, as it can give you an idea of how newer versions compare in performance to older versions.
Live Monitoring
But perhaps the most interesting feature is live monitoring. Yes, you can get, and view, performance data as your users access and navigate your application. This gives you and your team actionable insights into performance issues that affect your application.
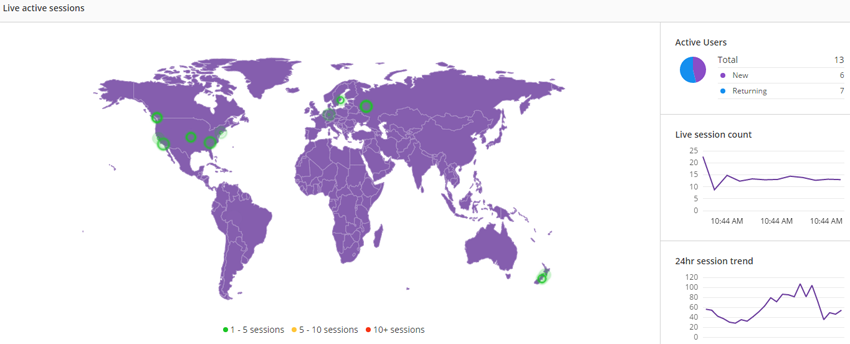
The Live tab gives you an overview of your site’s performance in real time, along with live requests, geo-distribution, and session trends over a 24-hour period. With an interactive map, you can view active session locations and session numbers.
My Experience
I briefly tested Raygun Real User Monitoring on a live, non-demo site that I built (the same application I used to test Raygun Application Performance Monitoring). The basic setup was a breeze. I simply added two script elements to the site’s template; however, I could have spent more time incorporating Real User Monitoring into my application to receive more thorough data, such as error reporting and user information.
I started seeing user experience data almost immediately and was aghast at the poor score my app received (not really: I knew it had issues going in). But what surprised me the most was the user journey—being able to retrace a user’s steps through my application and see their experience was truly amazing.
Real User Monitoring is definitely a tool you want to use in your applications to analyze your app’s performance and user experience.
Conclusion
Raygun Real User Monitoring is a fantastic service you can use to monitor your application’s performance. It paints a perfect picture of how your users experience your application, clearly pinpointing the pages and views that slow down your application.
