Traditionally, we associate user intent with search engines understanding users’ needs and desires, but as the Web gets more and more sophisticated, understanding user intent has become one of the key challenges in designing personalized user journeys, even beyond search.
Ah, personalization — the holy grail of customer experience! Everyone talks about it, very few really know how to do it right. And there’s a good reason for that: personalization is not a tick box exercise. It’s a complex undertaking due to the uniqueness of every user, and the need to respect their privacy while providing a personalized experience at the same time.
Thus, representing user intents as mathematical abstractions by plotting their actions and choices as points on a graph, enables us to visualize their uniqueness even when remaining (somewhat) anonymous.
Nowadays, relational data is naturally represented by graphs called networks of entities, which help us view and analyze the relationships between data points. These graphs can be applied to solving many real world problems, such as optimizing navigation between different locations and building recommendation engines, social graphs, and knowledge graphs.
Generally speaking, data can be graphed as long as it represents the interactions between its entities. For example, implicit social media relationships can be considered as a unified graph¹, with nodes representing entities such as users, pages, places, groups, comments, photos, photo albums, stories, videos, notes, and events as they interact with each other: e.g., a user posting a photo, video, or comment, a user updating their profile with their place of birth, a user liking a friend’s photo.
Before we attempt to represent user intents as a graph, however, let’s see a more formal description of what we mean by “graph data”, without going into a lot of mathematical details, only enough to develop an intuitive understanding of graphs.
Formally, a graph is defined by a set of nodes V and a set of edges E between those nodes. We denote an edge going from one node (A) to another node (B). In many cases, we will be concerned only with simple graphs, where there is at most one edge between each pair of nodes, no edges between a node and itself, and where the edges are all undirected.

A convenient way to represent graphs is through an adjacency matrix². To do that, let’s consider the relationship between users (U) and products (P) in an e-commerce scenario; we can represent the presence of edges as entries in this matrix:

Of course, some graphs can also have weighted edges, where the entries in the adjacency matrix are arbitrary real-values rather than {0, 1}. Additionally, graphs can have different types of edges. For instance, in our e-commerce scenarios, the interaction between users and products can take multiple forms: click, add to cart, add to wishlist, or purchase.
We can already see that our sample graph has two types of nodes: users and products. These are called bipartite heterogeneous graphs. Multipartite graphs are a well-known special case of heterogeneous graphs, where edges can only connect nodes that have different types, i.e., adding categories as a new type of node³.

Lastly, in many cases we also have attribute or feature information associated with a graph (e.g., a picture associated with a product). Most often these are node-level attributes that are represented using vectors or matrices and in heterogeneous graphs it’s usually the case that each different type of node has its own distinct type of attributes. In some cases, graphs are designed to support real-valued edge features in addition to discrete edge types, and in rare cases real-valued features are associated with entire graphs.
In recent years, Graph Neural Networks have gained popularity in various domains due to their power and flexibility in modeling the dependencies between nodes. There are mainly three types of problems that can be solved by using machine learning with graphs:
1. Node Classification
Node classification is useful for inferring information about a node based on its relationship with other nodes in the graph. Suppose we are given a large dataset of millions of products that are being commercialized on a marketplace, and we know that a significant number of these products are fake. Identifying these fake products is important both for the company that doesn’t want to promote fake offers (not to mention the fact that the users who “sell” those products are in breach of the terms and services) and for the buyers who will be at the risk of ordering (and paying for) products that may never reach their destination.
It’s expensive to manually examine every product users post, so having a model that could classify products as fake (or not) seems like an elegant, more cost effective solution.
This is a classic example of node classification, where the goal is to predict the label — which could be a type, category, or attribute⁴ — associated with all the nodes, when we are only given the true labels on a training set of nodes. Node classification is perhaps the most popular machine learning task on graph data, especially in recent years.
2. Relational inference
Along with node classification, relational inference is one of the more popular machine learning tasks with graph data and has countless real-world applications: product recommendations in e-commerce scenarios, predicting drug side-effects, or inferring new facts in relational databases — all of these tasks can be viewed as special cases of relation prediction.
The standard setup for relational inference is that we are given a set of nodes V and an incomplete set of edges between these nodes and the goal is to use this partial information to infer the missing edges. In simple graphs, such as recommender systems that only encode “purchase” relations, there are simple heuristics based on how many neighbors two nodes share that can achieve strong performance. On the other hand, in more complex multi-relational graph datasets, such as biomedical knowledge graphs that encode hundreds of different biological interactions, relation prediction can require complex reasoning and inference strategies.
3. Clustering
While node classification and relation prediction require inferring missing information about graph data, thereby making them, in many ways, analogous to supervised learning; cluster detection, in contrast, is more analogous to unsupervised clustering.
Again, in our e-commerce scenario, let’s say we have a database of user profiles, and we make a collaboration graph that connects two user profiles that express similar preferences. If we were to examine it, we’d notice that the graph segregates into different clusters of nodes, grouped together by product affinities, total order values, or other similar demographic factors.
The general intuition in graph clustering is to surface nodes that are much more likely to form edges with nodes that belong to the same cluster.
After that short introduction to graph theory, we’re ready to build our user intent graph. We first need to define the nodes before describing the relationships between them. At first glance, for an e-commerce recommender system, it’s pretty straightforward to represent the nodes as users, products, and the edges as interactions — as we’ve seen in the graphs above.
But how do we define intent and how do we represent that in our graph?
If a user visits 3 products, what can we tell about her intent? Or if the same user adds one item to the cart, are we more clear on her intent? What if instead of finalizing the order, she visits the “Contact Us” page?
User intent is defined as the purpose of a user’s series of actions⁵. Marketers have been traditionally working with a standard set of intents, mainly inspired by Google’s search algorithm:
- Navigational — user wants to find a specific page or site (branded keywords)
- Informational — user wants to answer a specific question (queries that include “how to”, “what is”, “where is”, “why do”)
- Transactional — user wants to complete an action (conversion, signup, phone call)
Obviously, a user with a navigational intent would have very different expectations for their landing page than one that’s in a transactional mindset. Hence the need for personalization.
Thus, the complexity of our graph is tied to the way we define users, items, and intents: if we consider a finite number of intent classes (navigational, informational, transactional) then our graph can look pretty clean, but if an intent can take a multitude of values depending on the specifics of the industry they are actively engaged in at any given time, and the characteristics of the items themselves, then the picture becomes fuzzier.

That’s why, for e-commerce journeys, we might be looking at the following types of intents: (1) goal-oriented intents; (2) affinity-oriented intents; (3) metrics-oriented intents. And it’s important to note that we’re expecting users to manifest a combination of intents, not just a dominant one.

To begin the representation of our user intent graph, we can imagine that each user (U) is linked to their sessions (S) and during each session the user interacts with products (P) — each with their own attributes (A).

There are certain events that users can do in their session that are not necessarily linked to a specific item: signing up, churning, or browsing. While others that are linked to the items and cart: abandoning the cart, adding to the cart, and checkout.

Users can also search, in which case there are common queries linked to items and categories of items.

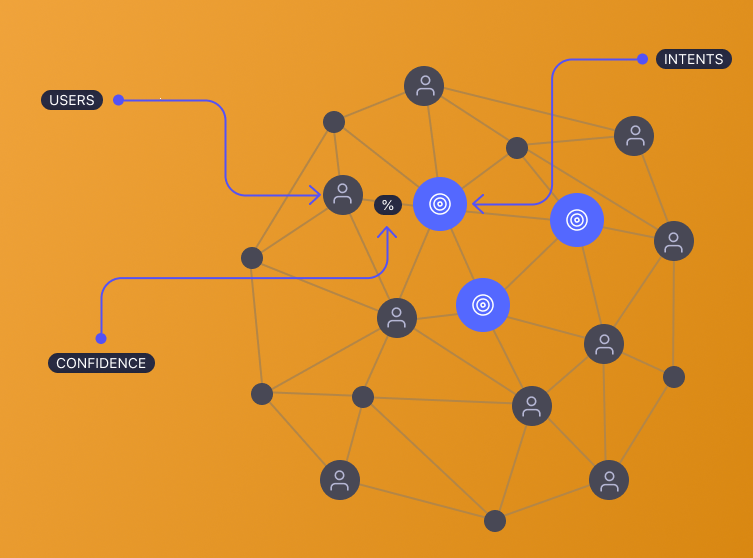
As complex as the user intent graph has become, we can “compress” it to the following diagram:

In a REST API format, you’d expect something like /1/users/{identifier}/fetch to respond with:
In practice, you want to be able to explore the user intent graph and easily extract users based on any given combination of intents:
intents.cart_abandonment.probability: 0.5 TO 0.9 AND intents.next_order_value.value >= 50 AND intents.affinities.brand.value = “adidas” AND intents.affinities.brand.probability > 0.5
Let’s briefly talk about the type of applications the user intent graph enables us to build. We’ve already started this article by making references to personalization, but what can we personalize based on intent?
1. Search
For e-commerce websites that have an almost unlimited database of products, personalization is a really crucial capability for their end-users. If our user intent graph is equipped with user affinities then personalizing search results becomes pretty straight forward.
2. Recommendations
Similarly, we could use next order value intent as a filter for surfacing products inside a category that the user is currently browsing or as an upselling opportunity in the cart, matching the user’s buying power.
3. Journeys
Last but not least, we can go beyond on-site search and recommend and adjust or orchestrate user journeys depending on their intent. What if our users are not interested in buying any of our items and they’re just browsing around?
Why not prompt them to subscribe to the newsletter, or sign up to the blog, follow on social media, etc.? Sometimes, the best thing for a user is not to add to cart, but to read more about a certain product or a service before deciding to purchase, which might come in later sessions.
Assisting the user and personalizing her journey can be achieved via a user intent graph that’s capable of surfacing next best actions the user should take in order to reach a certain goal. For example, if our user is more likely to sign up to the newsletter than add to a cart, what do you think the right call to action should be?