Web application development is difficult. There is no other type of application that is as involved, or requires you to understand multiple languages, frameworks, and platforms, as web applications. The most basic web application is comprised of two separate applications:
- The server-side application to manage data.
- The client-side application displays that data to the user.
The simplest application is written in two languages—one for the server, and HTML for the client. But that’s not all: modern applications require you to understand many languages, frameworks, and development tools. At best, an application is developed by multiple teams that can individually focus on smaller pieces of the larger whole. At worst, a team as small as one person develops the entire application.
But the story doesn’t end when an application is “finished”. After a lengthy and involved development processes, there are countless hours of testing for bugs, security issues, integration, performance, and user experience. Although many developers won’t admit it, performance and the user experience are often overlooked. The result, of course, is that slow, unrefined applications are released into production.
That’s exactly why tools like Raygun’s Application Performance Monitoring (APM) and Real User Monitoring (RUM) exist. They provide developers the means to quickly analyze not only how your application performs in production, but it pinpoints the exact performance issues down to the method or database query, as well as visualizing your visitors’ experiences.
In this article, I will walk you through my experience using Raygun’s APM and RUM to pinpoint issues in a live, in-production website and the steps I took to fix them.
The Problem: A Legacy Application With a Complex Codebase
I work in a fast-paced environment where quantity is more important than quality. That’s not to suggest the software I or my co-workers write is subpar; our applications work well. But the demand on our time requires us to focus more on bugs and security than performance and the user experience.
I recently used Raygun’s APM and RUM to monitor our main public web application: an informational website for the company’s investors. It is written in C# and runs on the .NET 4.6.x runtime.
This application started as multiple small projects written by a team of three people with minimal communication. The projects shared a “core” library that quickly grew into a massive, unwieldy behemoth with a lot of duplicated functionality (as I said, there wasn’t a lot of communication).
Over the years, the multiple projects morphed into a single large application. It pulls information from multiple MSSQL databases and an IBM DB2 machine to provide visitors with a wide array of economic and industry information. It interacts with other systems on the network, ranging from mail and file servers and other RESTful API services to perform other tasks.
I should also mention that I am somewhat unique in that I have a heavy IT background. My job title is “Programmer/Analyst”, but my actual duties consist of network and systems admin, programmer, and analyst. So when it comes to analyzing any issue, I’m equipped to examine both the code and the systems it runs on and interacts with.
Identifying Performance Issues
I know that my application has several performance issues; one of them is the authentication experience. Visitors must first authenticate using their credentials and then provide their OTP (one-time passcode) for two-factor authentication. Some visitors use a separate authenticator app on their mobile device to generate their OTPs, but most visitors receive their code via email. For the latter group, the authentication experience can take anywhere from 1 to 30 seconds, with most visitors experiencing longer waits.
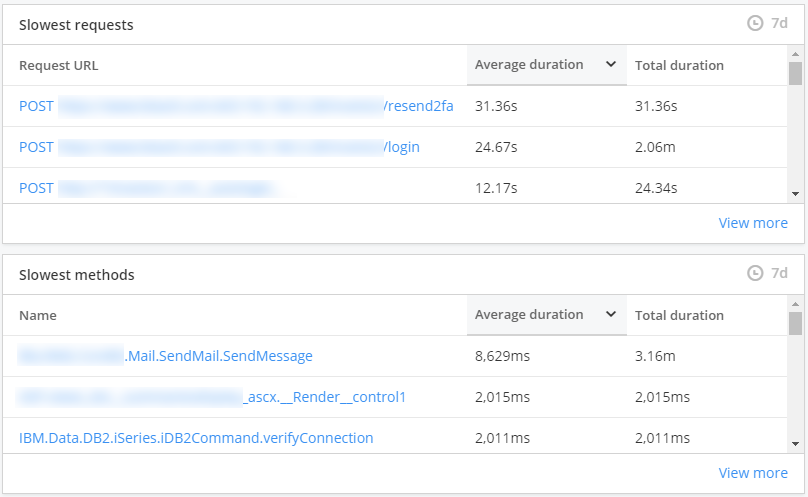
After installing and configuring Raygun’s APM agent (a very simple process), I started seeing trace data in the dashboard within a minute. The dashboard gives you a glimpse of your application’s performance issues, providing tables and graphs showing the slowest requests, class methods, traces, SQL commands, and external API calls. Sure enough, some of the immediate offenders were related to the authentication process.

The top two slow URLs are used during the authentication process for visitors with emailed OTPs. Both are concerning (holy cow! 31 seconds for one request for /resend2fa). I certainly want to fix all the issues, but my time is limited. Therefore, fixing some of the issues with the /login endpoint is my priority.
Judging from the data provided by the “Slowest requests” table, I already suspect that the culprit is related to the process of sending emails. To be sure, I click the /login link to view the data that APM collected on that URL.
Analyzing the Data
APM collects a lot of information for every request, and it is extremely helpful because it can break down a request into its smaller parts—the methods that execute to provide the visitor with a response. The following screenshot shows the methods, ranked slowest to fastest, for the /login URL:

As expected, the main issue has something to do with the email process. It’s also interesting that the IBM DB2 ADO.NET provider is used during authentication. It shouldn’t be, and it’s taking a rather significant amount of time to clear error info (as denoted by the call to IBM.Data.DB2.iSeries.MPConnection.clearErrorInfo()) that shouldn’t even be there. But that’s an issue for another day.
Apart from daily notifications, all emails sent by the website are dispatched on demand. The code that sends these emails is used in a variety of other applications that does not exhibit any performance issues. So in my mind, neither the code or the email server is at fault—there’s something wrong on the machine that runs our public site.
There are so many things on a computer system that can cause performance issues. So, after viewing the logs and not seeing any apparent causes, I decide to spin up a new virtual machine and test the website on it. After installing the APM agent on the new machine and testing the login process, I notice a tremendous improvement.

The above screenshot shows the breakdown of where the application calls the SendMessage() method. Simply transferring the application to another machine cut the login process down by 26 seconds! While that’s certainly a huge improvement, it still takes an average of 4-5 seconds for the initial login process.
Examining the flamechart for a single /login request (shown below), I can clearly see that sending an email is still an issue because SendMessage() still takes at least 3 seconds to completely execute.

I can solve this problem by submitting the email message to a queue or batch, and let a separate process send the message. But that feels like a work-around to me. I’d rather find and fix the issue, but I also need to manage my time. There are other, arguably more important projects that I need to complete.
Analyzing the User Experience
Raygun’s APM gives you clear performance data for your server, but that’s only half of your application. What happens in the browser is just as important as what happens on the server, and Raygun’s Real User Monitoring (RUM) gives you insight into how your users experience your application. Not only can it track your users’ individual sessions and provide usage statistics (such as number of page visits, durations, and browsers), but it can also give you an accurate picture of their experience as they navigate from page to page.
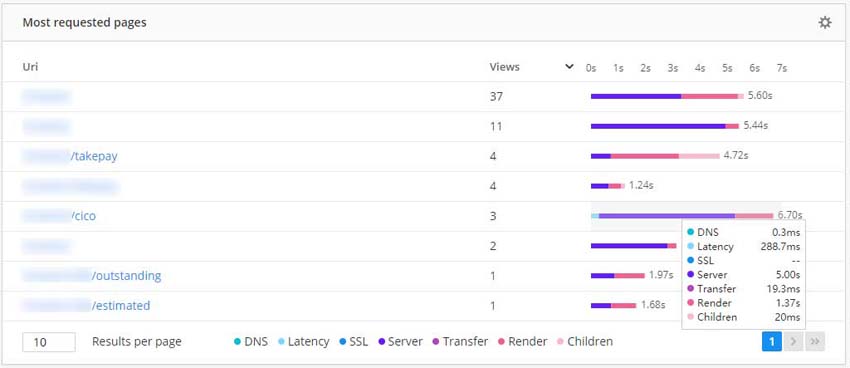
RUM also displays each requested page and breaks down a its load time into different factors, as shown here:

The /cico URL in this screenshot has a rather high server time of 5 seconds, which is understandable because that page calculates a lot of data gathered from multiple sources on the fly. But now that I see that working with live data greatly slows down the page load, I need to implement a caching/summarizing solution.
Notice that the /takepay URL has a rather small server time (it works with cached/summarized data), but it has a large render time due to rendering interactive graphs with many data points. So, I can easily solve the slow server response for /cico by daily caching or summarizing the data it works with in a separate process.
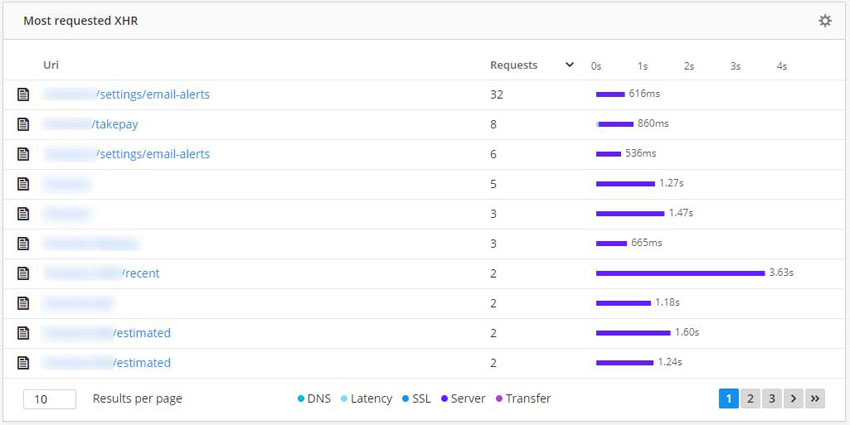
But there’s more to performance and a user’s experience than just response times; when properly configured, RUM catalogs all requests—including XHR, as shown below:

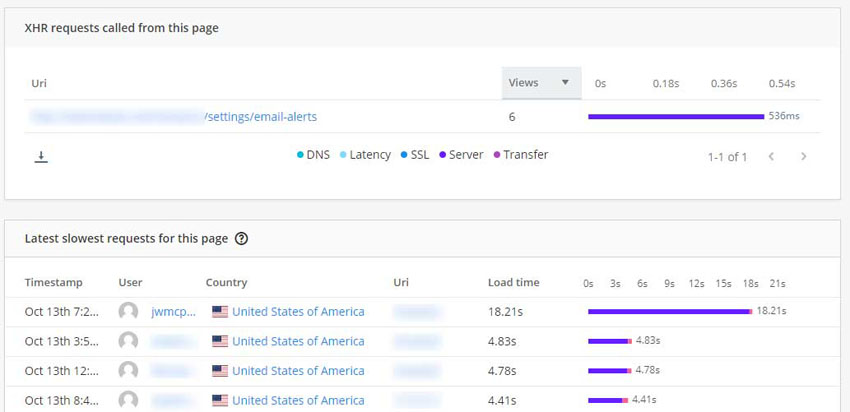
The first thing that caught my eye were the 30+ requests for the /settings/email-alerts URL. Either 30+ people viewed/changed their email alert settings, or that XHR is automatically executed on one of the pages. Unfortunately, RUM didn’t give me an immediate idea of what page made the XHR, but I did eventually find the culprits when viewing the performance reports for various pages:

Those needless XHRs do contribute to the load time, and eliminating them can make a big difference..
Conclusion
Raygun provides an invaluable service. As my experience shows, by using APM and Real User Monitoring, you can easily monitor your application’s performance.
They automatically pinpoint the performance issues on both the server and client, which is vital in a fast-paced environment. They truly are fantastic services and you can try them free today!

