Today, I’ll cover Chart.js, a very popular JavaScript library, and teach you how to incorporate charts of this library into Bootstrap 5 tabs/pills. The idea is that each time we click on a Bootstrap tab, the target chart will be reconstructed and hence reanimated.
Bear in mind that this technique can work for embedding such a chart into a tab component of any front-end framework.
Get up to Speed With Charts
In previous tutorials, I’ve shown you how to create different kinds of charts utilizing either only CSS or a JavaScript charting library like HighCharts.js. Dive in and find your favourite approach!
What are Tabs/Pills?
Tabs help us divide content into multiple sections that live under a common parent. At any given time, only one of these sections is visible. Imagine them like browser tabs with the difference that you don’t have to change the page to view them all.
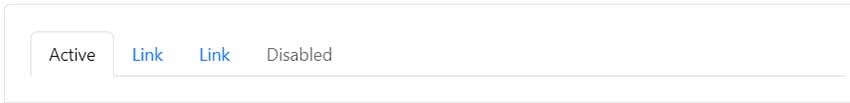
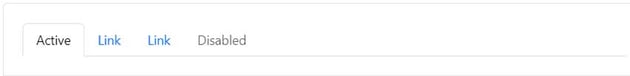

Pills are a tabs variation.

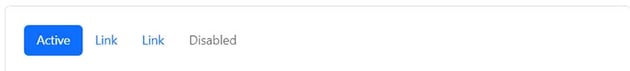

For this demonstration, as discussed above, we’ll work with Bootstrap tabs/pills.
What is Chart.js?
Chart.js is one of the most dominant JavaScript charting libraries with over 62K GitHub Stars. It’s free, easy to use, customizable, and compatible with all major JavaScript frameworks. Unlike other charting libraries that render chart elements as SVGs, it’s an HTML5 canvas-based charting library.
It supports all the common chart types like bar (column) charts, line charts, pie charts, and donut charts but also more complex ones like radar charts. In our case, we’ll work with bar charts.
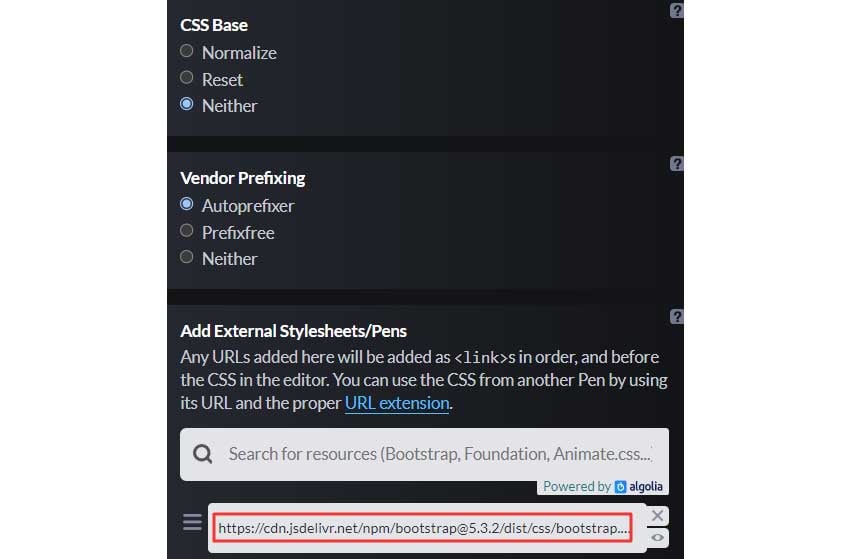
Required Assets
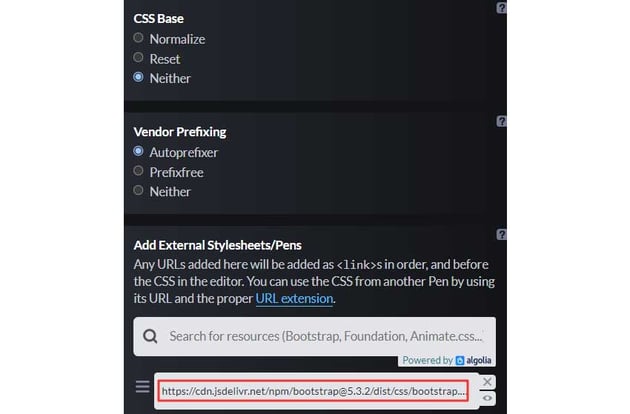
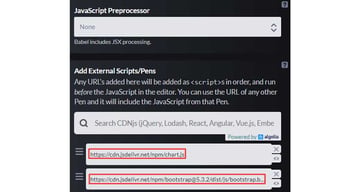
To kick things off, we’ll include the required Bootstrap and Chart.js files within our CodePen demo:


Optionally, we’ll include a custom Google Font that will be a good example for learning how to add a custom font to Chart.js.
Data
In our case, we’ll have three tabs, so we’ll create three charts. Data will be different for each chart. In a real-world scenario, the data would come from a third-party system like a CMS, and we’d have to send it to our JavaScript for manipulation. Here, we’ll work with some dummy, hardcoded data, but in another tutorial, I’ll show you how to create these data dynamically through WordPress.
In any case, the important thing is the data structure. Our data will live under an array of objects (yours can be different)—each object will represent a chart:
1 |
const charts = [ |
2 |
{
|
3 |
bars: { |
4 |
bar1: ["25", "76", "64", "33", "85", "46", "25"], |
5 |
bar2: ["32", "68", "77", "29", "88", "65", "60"] |
6 |
},
|
7 |
labels: [ |
8 |
"Label 1", |
9 |
"Label 2", |
10 |
"Label 3", |
11 |
"Label 4", |
12 |
"Label 5", |
13 |
"Label 6", |
14 |
"Label 7" |
15 |
],
|
16 |
legends: { legend1: "Male", legend2: "Female" }, |
17 |
title: "Gender Comparison Graph" |
18 |
},
|
19 |
//two more objects here
|
20 |
];
|
Chart.js Integration With Bootstrap Tabs
We’ll create a Bootstrap tab component by copying the basic code that is provided in the documentation and just altering the texts.

Inside each panel, we’ll place a different canvas element—remember Charts.js is a canvas-based library.
Here’s the markup:
1 |
<div class="container my-5"> |
2 |
<ul class="nav nav-tabs" id="myTab" role="tablist"> |
3 |
<li class="nav-item" role="presentation"> |
4 |
<button class="nav-link active" id="chart1-tab" data-bs-toggle="tab" data-bs-target="#chart1-tab-pane" type="button" role="tab" aria-controls="chart1-tab-pane" aria-selected="true">Bar Chart 1</button> |
5 |
</li>
|
6 |
<li class="nav-item" role="presentation"> |
7 |
<button class="nav-link" id="chart2-tab" data-bs-toggle="tab" data-bs-target="#chart2-tab-pane" type="button" role="tab" aria-controls="chart2-tab-pane" aria-selected="false">Bar Chart 2</button> |
8 |
</li>
|
9 |
<li class="nav-item" role="presentation"> |
10 |
<button class="nav-link" id="chart3-tab" data-bs-toggle="tab" data-bs-target="#chart3-tab-pane" type="button" role="tab" aria-controls="chart3-tab-pane" aria-selected="false">Bar Chart 3</button> |
11 |
</li>
|
12 |
</ul>
|
13 |
<div class="tab-content mt-5" id="myTabContent"> |
14 |
<div class="tab-pane fade show active" id="chart1-tab-pane" role="tabpanel" aria-labelledby="chart1-tab" tabindex="0"> |
15 |
<canvas id="myChart1"></canvas> |
16 |
</div>
|
17 |
<div class="tab-pane fade" id="chart2-tab-pane" role="tabpanel" aria-labelledby="chart2-tab" tabindex="0"> |
18 |
<canvas id="myChart2"></canvas> |
19 |
</div>
|
20 |
<div class="tab-pane fade" id="chart3-tab-pane" role="tabpanel" aria-labelledby="chart3-tab" tabindex="0"> |
21 |
<canvas id="myChart3"></canvas> |
22 |
</div>
|
23 |
</div>
|
24 |
</div>
|
By default, through the Chart.defaults object (print its contents in the console!), we’ll force our chart texts to have a dark cyan color and render a custom Google Font. Remember to set options through this global object in case you have charts that share common things.
1 |
Chart.defaults.font.family = "Poppins, sans-serif"; |
2 |
Chart.defaults.color = "#073b4c"; |
With the help of the shown.bs.tab Bootstrap tab event, each time a new tab is shown, we’ll grab the index of the active tab and pass it as a parameter of the initializeSingleChart() function. We’ll also call that function initially and pass it 0 (arrays are zero-based) to render the chart of the first tab which is by default active.
Note that we would pass a different number if we wanted to have another active tab by default.
1 |
const tabEls = document.querySelectorAll('button[data-bs-toggle="tab"]'); |
2 |
initializeSingleChart(0); |
3 |
|
4 |
tabEls.forEach(function (tabEl) { |
5 |
tabEl.addEventListener("shown.bs.tab", function (event) { |
6 |
const index = Array.from(tabEls).indexOf(event.target); |
7 |
initializeSingleChart(index); |
8 |
});
|
9 |
});
|
Inside the initializeSingleChart() function, we’ll construct the column chart of the associated tab panel. But here’s the thing: to replay the animation upon tab click, we’ll first destroy the chart if it exists, then reconstruct it.
An alternative implementation, perhaps even more solid, especially if you have lots of data, instead of destroying and recreating it, might be to somehow update the chart using the update() method.
Finally, we’ll show the values of the y-axis as percentages by creating custom tick formats.
Here’s the required JavaScript code:
1 |
function initializeSingleChart(index) { |
2 |
const chart = charts[index]; |
3 |
const chartEl = `myChart${++index}`; |
4 |
const chartInstance = Chart.getChart(chartEl); |
5 |
|
6 |
if (chartInstance !== undefined) { |
7 |
chartInstance.destroy(); |
8 |
}
|
9 |
|
10 |
const data = { |
11 |
labels: chart.labels, |
12 |
datasets: [ |
13 |
{
|
14 |
label: chart.legends.legend1, |
15 |
data: chart.bars.bar1, |
16 |
backgroundColor: "#dc3545" |
17 |
},
|
18 |
{
|
19 |
label: chart.legends.legend2, |
20 |
data: chart.bars.bar2, |
21 |
backgroundColor: "#198754" |
22 |
}
|
23 |
]
|
24 |
};
|
25 |
|
26 |
const config = { |
27 |
type: "bar", |
28 |
data, |
29 |
options: { |
30 |
plugins: { |
31 |
title: { |
32 |
display: true, |
33 |
text: chart.title, |
34 |
position: "top", |
35 |
font: { |
36 |
size: 25 |
37 |
},
|
38 |
padding: { |
39 |
top: 15, |
40 |
bottom: 15 |
41 |
}
|
42 |
},
|
43 |
legend: { |
44 |
position: "bottom", |
45 |
labels: { |
46 |
padding: 30, |
47 |
font: { |
48 |
size: 14 |
49 |
}
|
50 |
}
|
51 |
},
|
52 |
tooltip: { |
53 |
enabled: false |
54 |
}
|
55 |
},
|
56 |
scales: { |
57 |
y: { |
58 |
ticks: { |
59 |
crossAlign: "left", |
60 |
callback: function (val) { |
61 |
return `${val}%`; |
62 |
}
|
63 |
}
|
64 |
}
|
65 |
}
|
66 |
}
|
67 |
};
|
68 |
|
69 |
const ctx = document.getElementById(chartEl).getContext("2d"); |
70 |
new Chart(ctx, config); |
71 |
}
|
Chart.js Integration With Bootstrap Pills
We’ll create a Bootstrap pill component by copying the basic code that is provided in the documentation and just altering the texts.


Here’s the markup:
1 |
<div class="container my-5"> |
2 |
<ul class="nav nav-pills mb-3" id="pills-tab" role="tablist"> |
3 |
<li class="nav-item" role="presentation"> |
4 |
<button class="nav-link active" id="pills-chart1-tab" data-bs-toggle="pill" data-bs-target="#pills-chart1" type="button" role="tab" aria-controls="pills-chart1" aria-selected="true">Bar Chart1</button> |
5 |
</li>
|
6 |
<li class="nav-item" role="presentation"> |
7 |
<button class="nav-link" id="pills-chart2-tab" data-bs-toggle="pill" data-bs-target="#pills-chart2" type="button" role="tab" aria-controls="pills-chart2" aria-selected="false">Bar Chart2</button> |
8 |
</li>
|
9 |
<li class="nav-item" role="presentation"> |
10 |
<button class="nav-link" id="pills-chart3-tab" data-bs-toggle="pill" data-bs-target="#pills-chart3" type="button" role="tab" aria-controls="pills-chart3" aria-selected="false">Bar Chart3</button> |
11 |
</li>
|
12 |
</ul>
|
13 |
<div class="tab-content mt-5" id="pills-tabContent"> |
14 |
<div class="tab-pane fade show active" id="pills-chart1" role="tabpanel" aria-labelledby="pills-chart1-tab" tabindex="0"> |
15 |
<canvas id="myChart1"></canvas> |
16 |
</div>
|
17 |
<div class="tab-pane fade" id="pills-chart2" role="tabpanel" aria-labelledby="pills-chart2-tab" tabindex="0"> |
18 |
<canvas id="myChart2"></canvas> |
19 |
</div>
|
20 |
<div class="tab-pane fade" id="pills-chart3" role="tabpanel" aria-labelledby="pills-chart3-tab" tabindex="0"> |
21 |
<canvas id="myChart3"></canvas> |
22 |
</div>
|
23 |
</div>
|
24 |
</div>
|
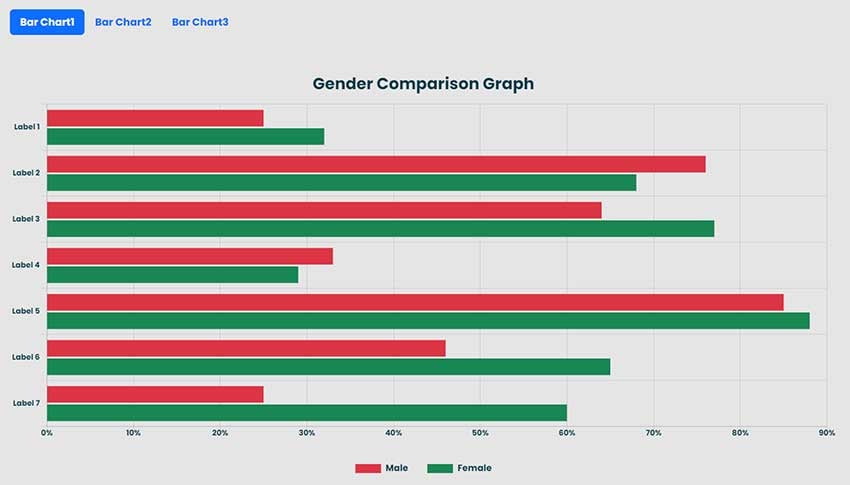
The rest of the JavaScript code remains the same apart from two changes: first, we’ll target pills and not tabs. Secondly, we’ll change the base axis of the dataset from x to y via the indexAxis property. This way, we’ll change our chart from vertical to horizontal. As a result of that, we’ll show as percentages the values of the x-axis and not the y-axis.
Here are the code differences compared to the tabs:
1 |
const tabEls = document.querySelectorAll('button[data-bs-toggle="pill"]'); |
2 |
|
3 |
...
|
4 |
|
5 |
function initializeSingleChart(index) { |
6 |
...
|
7 |
|
8 |
indexAxis: "y", |
9 |
scales: { |
10 |
x: { |
11 |
ticks: { |
12 |
callback: function (val) { |
13 |
return `${val}%`; |
14 |
}
|
15 |
}
|
16 |
}
|
17 |
}
|
18 |
}
|
Conclusion
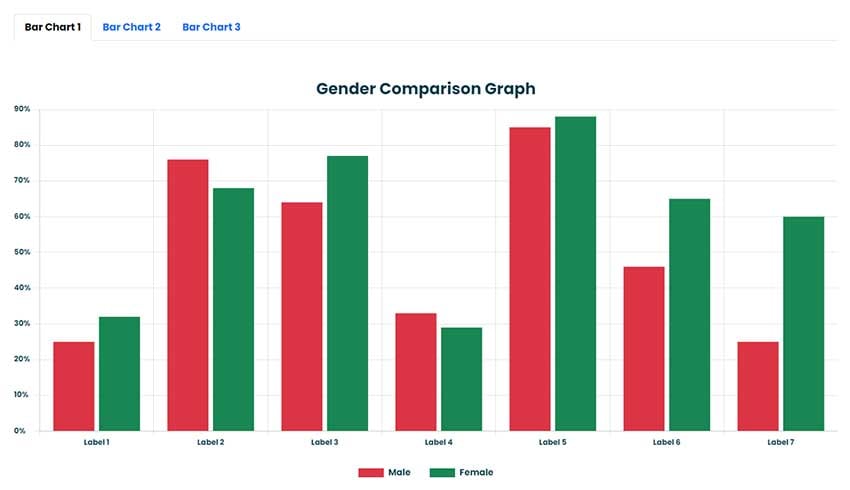
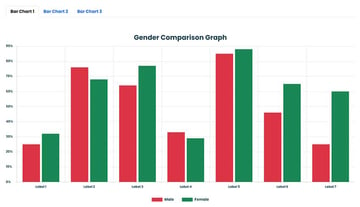
Done! During this tutorial, we learned how to create and animate horizontal and vertical bar charts using the Chart.js library each time a Bootstrap 5 tab/pill becomes active. As mentioned before, remember that this implementation will work with other front-end frameworks as well as for other chart types.
Let’s recall what we built today:
In another tutorial, I’ll show you how to make the hardcoded data we used here dynamic, by pulling it from the WordPress CMS. This way, you’ll have total control of creating any chart type you want with real data and even embedding it in front-end framework components like tabs!
As always, thanks a lot for reading!