When working with large amounts of data, you are likely to come across situations where the data has to be represented visually with the help of graphs.
A graph is a structure amounting to a set of objects in which some pairs of the objects are in some sense “related”. They are basically mathematical structures used to model pairwise relations between objects. (Wikipedia)
If you implement everything on your own, visually representing data in form of graphs will require you to spend significant amount of time on writing the code for handling the graph structure. In this post, we have created a list of some of the best free JavaScript graph visualization libraries that will do all the heavy lifting for you.
People generally use the terms graphs and charts interchangeably. We have also got you covered with a list of best free JavaScript charting libraries if you were looking for those instead of graph visualization libraries.
1. D3.js
The first library that comes to mind whenever you are doing anything related to visualization of any kind of data either in the form of charts or graphs in D3.js. The D3 is short for Data-Driven Documents. It uses a combination of HTML, SVG and CSS to create visual representation of data.

The library basically allows you to bind arbitrary data to the DOM. After that it is possible to create all types of charts and graphs based on this data. The library gives you access to different methods and functions that you can use to make element selections. It also allows you to dynamically set the property values of different elements based on given data.
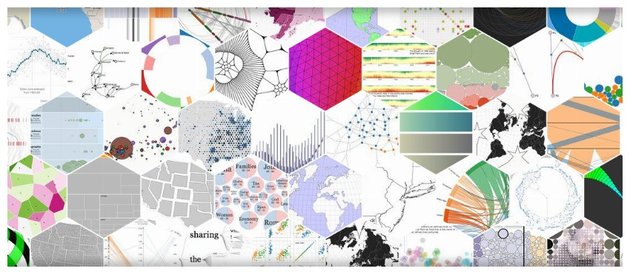
You can visit the website D3 Graph Library to see all the possibilities. It contains a bunch of different charts and graphs to show you the capabilities of D3.js.
One important thing to keep in mind is that the library does not come with built-in methods to help you directly create any bars or charts by calling a single method. You will have to implement that functionality on your own. However, it comes with a lot of helper functions to help you do all those things relatively easily.
2. Neo4j
As I mentioned earlier, D3.js is a powerful library for creating all kinds of graphs and charts. However, it requires you to do a lot of work in order to create any kind of graph visualization. One way to overcome this limitation is to use helper libraries based on D3.js which do all the basic heavy-lifting for you.
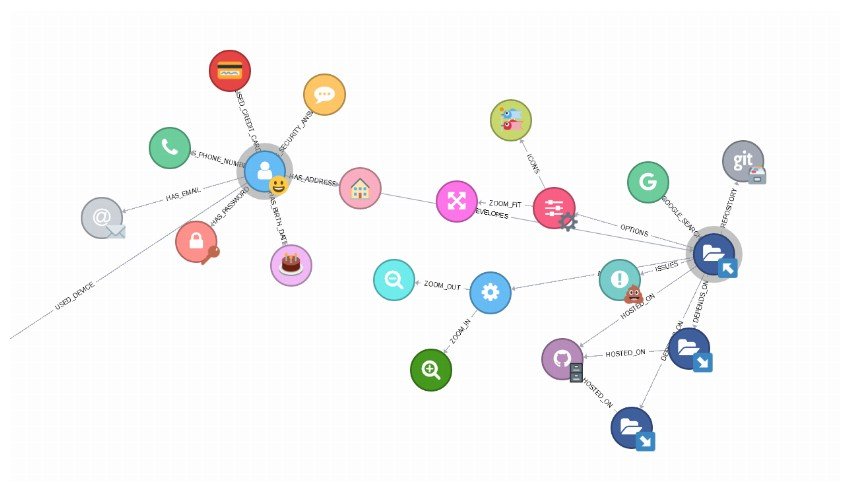

One example of such a library is Neo4j. It has several useful features such as compatibility with multiple data formats, force simulations, double click callbacks, and custom node colors based on the node type. You can also show information about different nodes and their relationship with each other inside an info panel.
You can zoom and pan through the graph. The library also has auto-fit and relationship auto-orientation features. Dragging a node will make it sticky and clicking it again will take it back to its initial non-sticky state.
You can also provide callbacks for different events using options like onNodeClick, onNodeDoubleClick, onNodeDragStart, onNodeDragEnd etc. The example on the website adds a bunch of new nodes attached to the original node on each double click event.
3. React D3 Graph
React D3 Graph is yet another D3.js based graph generation library that allows you to create interactive and configurable graphs with React.
The library comes with a main graph component that will allow you to build the actual graph once you pass all the relevant data to it. You can also optionally provide configuration information as well as callback functions to handle user events like node click and link click.
Keep in mind that this library does not come pre-packaged with React and D3.js. You will have to install those libraries separately. This gives you the freedom to independently choose separate versions of the libraries as long as they are above the minimum requirement.
There are a bunch of configuration options that you can specify for each graph, for example to make it directional, zoom on focus, change the animation duration during focus, or use panning and zooming behavior. You can also disable any drag-and-drop related manipulations of the graph or make the graph completely static.
4. VivaGraphJS
VivaGraphJS is a dependency-free library that you can use to render graphs. The library is extensible and comes with support for multiple rendering engines and layout algorithms. There are a lot of related modules that you can install to get required functionality into your graphs. This includes support for basic events, force directed graph layouts and storing graph data in JSON format.
The library offers a lot of customization options. You can change the appearance of nodes and links with little effort. Similarly, you have full control over the layout algorithm and the medium used to display the graph. For instance, you can tell the library to use WeBGL for rendering your graphs instead of SVG which it uses by default.
Any graphs that you render on the webpage will have a different structure based on factors such as the numbers of nodes and the number of connecting edges etc. You can use a bunch of parameters like springLength, springCoeff and gravity etc. to tune the physics so that the graphs you render look great.
5. Graphology
The Graphology library is a robust and multipurpose package written in JavaScript and TypeScript. The aim of the library is to add support for multiple types of graphs using the same unified interface. This allows you to create a wide variety of graphs that can be directed, undirected or mixed. You can also decide on features like whether to allow self-looping or support parallel edges.
Graphs that you create using graphology can emit events for a large variety of actions such as adding or removing a node as well as adding or removing an edge. There are also events that get triggered with node or edge attribute updates.
You can also include a lot of standard helper libraries in your project to get additional functionality. This includes things like the canvas package for rendering on the canvas or the shortest-path package with functions for applying common search algorithms like Dijkstra algorithm.
A separate library that works really well with Graphology is Sigma.js. It gives you access to a WebGL renderer and helps you create interactive graphs.
6. Cytoscape.js
Cytoscape.js is yet another great library for graph theory visualization and analysis of data. You can use it to visualize all kinds of relational data like social network connections or biological data. The library comes with a graph theory model and an optional renderer to display your interactive graphs. It is an all-in-one package to handle all your graphing needs.
The library is highly optimized and comes with good browser support. The support for browsers goes as far back as IE10 with partial support for IE9. All modern browsers enjoy fantastic support. The library also supports use of selectors for filtering and graph querying. It also uses stylesheets to keep data separate from presentation.
There is built-in support for standard gestures on both desktops and mobile devices. It has support for set theory operations and includes graph theory algorithms such as BFS and PageRank. You can be rest assured about the quality of the library because it is used by big companies such as Amazon and Google as well as government organizations.
You can read the Cytoscape.js documentation to get started with the library.
7. Arbor
Arbor is a simple graph visualization library that has been built using web workers and the jQuery library as its foundation. Unlike some other libraries in this list, Arbor does not aim to be a complete all-in-one solution.
It simply provides you an efficient, force-directed layout algorithm along with other abstractions for graph organization. It also comes with built-in support for handling screen refresh events. This simply means that the rendering of the data on the webpage is left to the developer. You are free to use canvas, SVG or HTML elements in order to create the graph depending on the needs of your project.
8. Force Graph
You can use the Force Graph library to render force-directed graphs on the HTML5 canvas. While the library uses the HTML5 canvas for rendering, it relies on the D3 force library to take care of the underlying physics. There is support for zooming and panning across the canvas. You can also drag the nodes around or listen to click and hover events for the nodes and their links.
There are plenty of methods available to control the styling of nodes as well as links. You can also use a bunch of methods to control how different elements of the graph are rendered.
What if you want to render your graph in 3D? Luckily, the library also has a 3D version that relies on WebGL and ThreeJS to handle the rendering. The underlying physics of the graph is taken care of either by the D3 force 3D library or the ngraph library.
Final Thoughts
Visualization of complicated data in form of graphs can help us easily understand the relationship between different entities. Graphs will help you convey data that is too large and complicated to be explained easily with just textual information.
In this post, we have provided you a brief overview of some of the most popular JavaScript libraries that help you visualize information in form of graphs. One of these libraries will likely meet your project needs. However, you can also search for graph visualization libraries on GitHub for more options.