But, as I understand that not all of your projects require this specific layout, we’ll first explore how to create a simple dynamic WordPress chart. And most importantly, without using a single WordPress chart plugin!
This tutorial expects that you are familiar with WordPress theme development and ideally with the Advanced Custom Fields (ACF) WordPress plugin.
Implementation
For the implementation part, I’ll work with my usual custom Playground theme.
Theme Structure
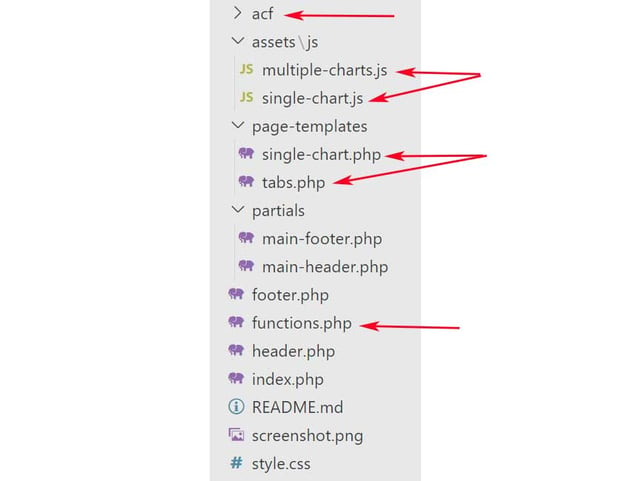
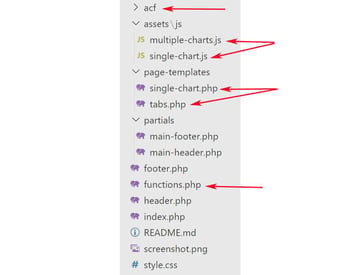
Let’s discuss the important files:
- The
single-chart.phpfile that will register the Single Chart Page custom template will be associated with thesingle-chart.jsfile. Both will be responsible for showing a single chart. - The
tabs.phpfile that will register the Tabs Page custom template will be associated with themultiple-charts.jsfile. Both will be responsible for showing Bootstrap tabs that will contain charts. -
Inside the
functions.phpfile, I’ll include the required Bootstrap and Chart.js files—the same versions as in the CodePen demo of the previous tutorial. Within this function, there will be the logic for generating the required chart data. - Inside the
acffolder, I’ll export in two methods all the extra fields that I’m going to use so that you can reuse them in your themes—you’ll see, in a moment, what I’m talking about.

Here’s the theme structure:

For your convenience, as usual, all the theme assets will be available on a GitHub repo.
Creating Extra Fields
If you look at the aforementioned tutorial, you’ll notice that each chart data is represented as an object; this is the format that we’ll also keep for our dynamic data.
1 |
{
|
2 |
bars: {
|
3 |
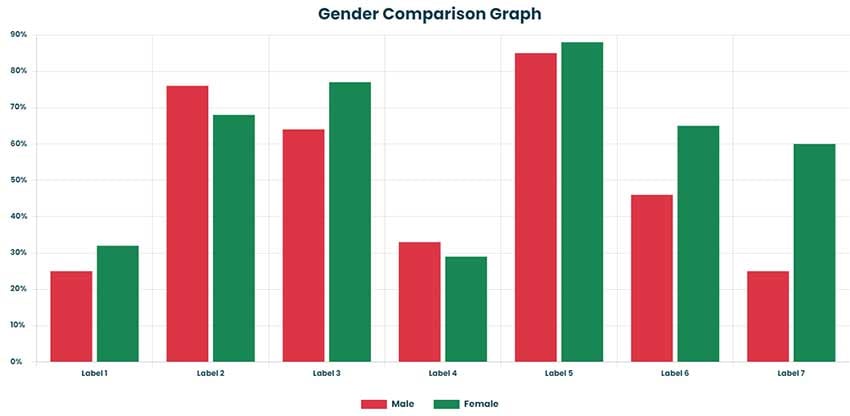
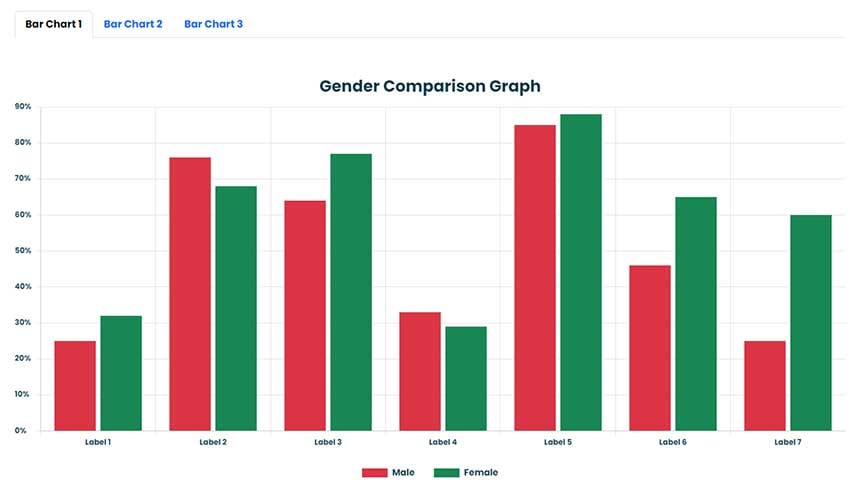
bar1: ["25", "76", "64", "33", "85", "46", "25"], |
4 |
bar2: ["32", "68", "77", "29", "88", "65", "60"] |
5 |
}, |
6 |
labels: [ |
7 |
"Label 1", |
8 |
"Label 2", |
9 |
"Label 3", |
10 |
"Label 4", |
11 |
"Label 5", |
12 |
"Label 6", |
13 |
"Label 7" |
14 |
], |
15 |
legends: { legend1: "Male", legend2: "Female" },
|
16 |
title: "Gender Comparison Graph" |
17 |
} |
To create the data, we’ll need some fields. Many plugins can help us create extra fields, like the Advanced Custom Fields (ACF) plugin, the Pods plugin, etc. For this exercise, I’ll choose the ACF PRO version to take advantage of its flexible content field.
Although I’ll utilize a premium plugin here for easier data manipulation, regardless of the plugin of your choice, the logic will remain the same. We’ll create some fields, then use the plugin functions to grab them, and finally format the data before sending them in JavaScript.
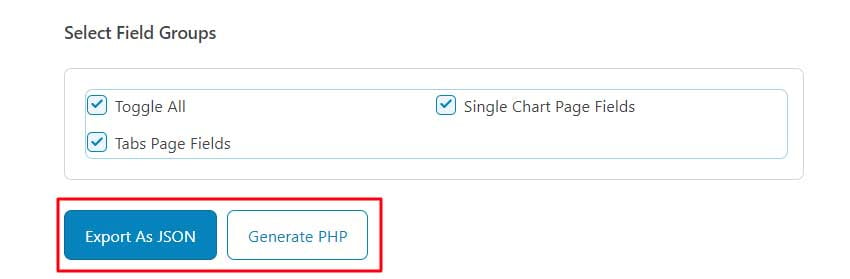
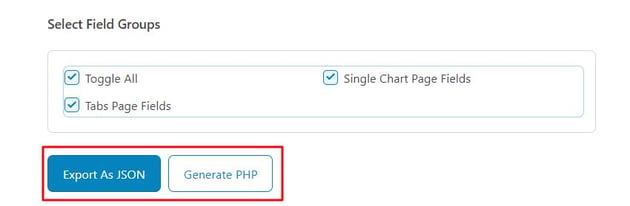
Again, as mentioned above, all the ACF fields will be exported both as JSON and PHP and live inside the acf theme folder.
As a spoiler, to prove to you that despite WordPress plugins, other tools let us equally create additional page fields, I’ll show you how to create a Theme Settings page using Carbon Fields in an upcoming tutorial.
Create a Single Chart
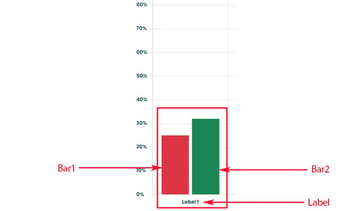
We’ll start showing how to embed a vertical bar chart in a WordPress page.

Using ACF, we’ll create a new field group and map it to the page we want—in my case, this will be the page with the Single Chart Page template.
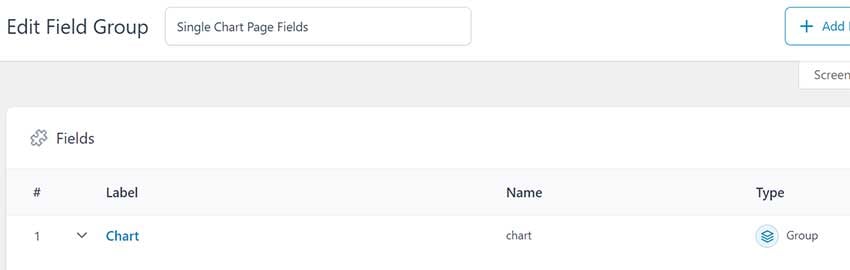
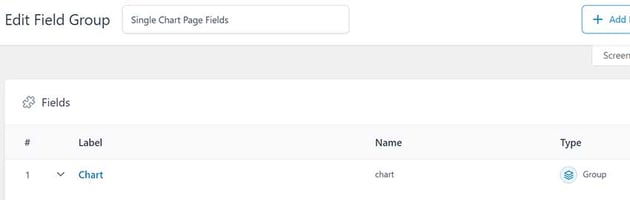
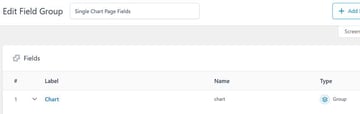
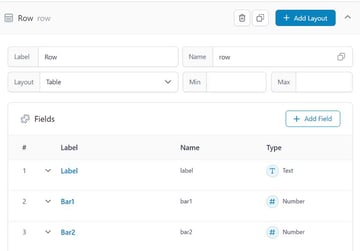
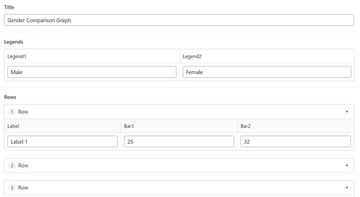
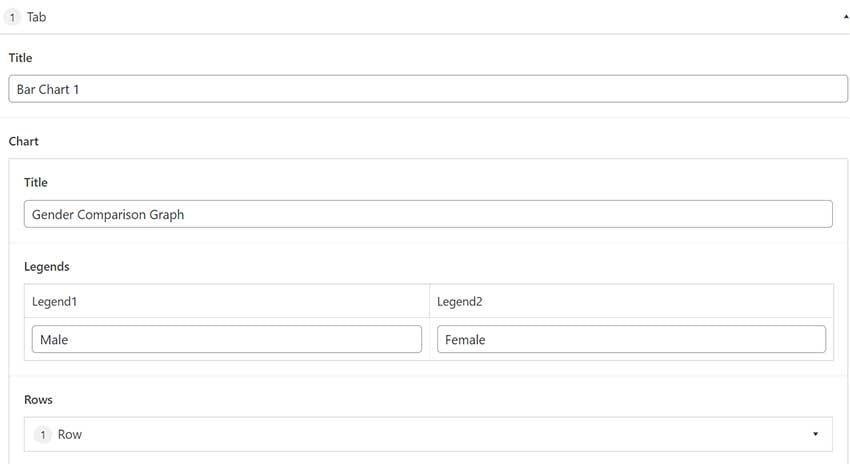
Inside that group, we’ll define three sub-fields.
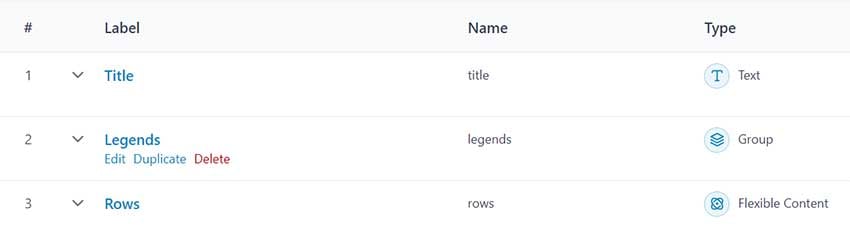
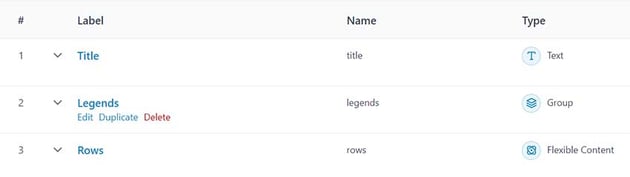
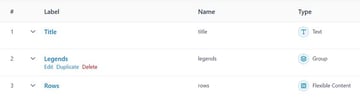
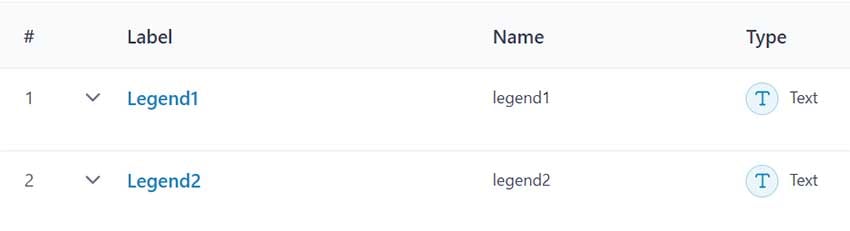
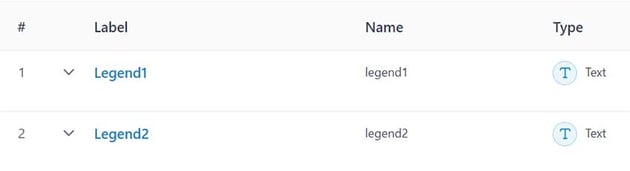
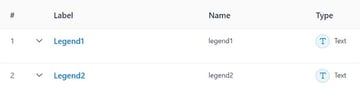
Inside the Legends subfield, we’ll specify two additional fields for labeling the datasets that will appear at the bottom of the chart.
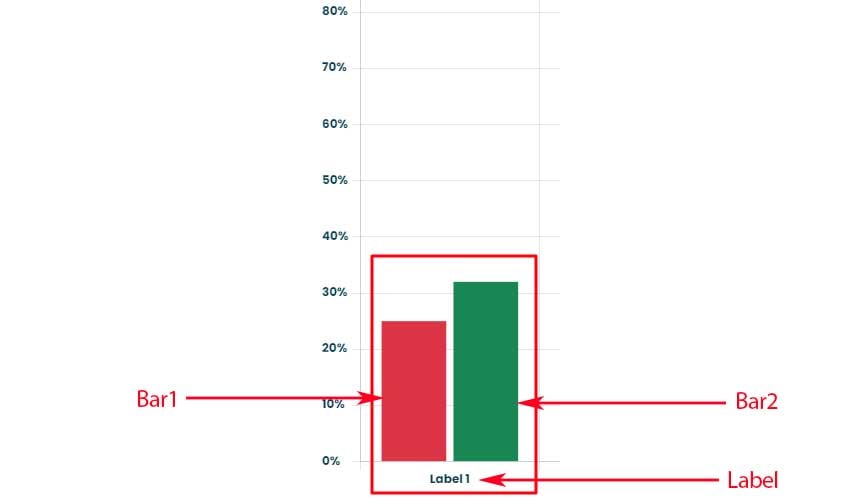
The Rows flexible content field will allow us to create an infinite number of rows where each row will represent a single set of vertical bars—consider it as a repeater with rows that can be collapsed.


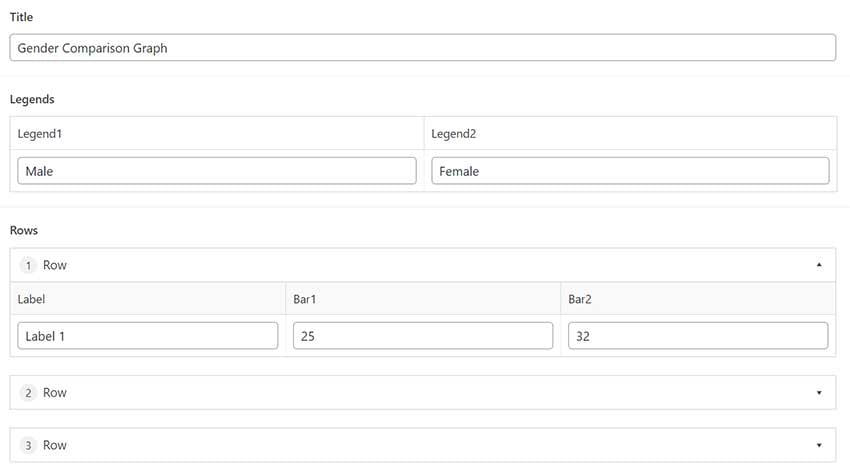
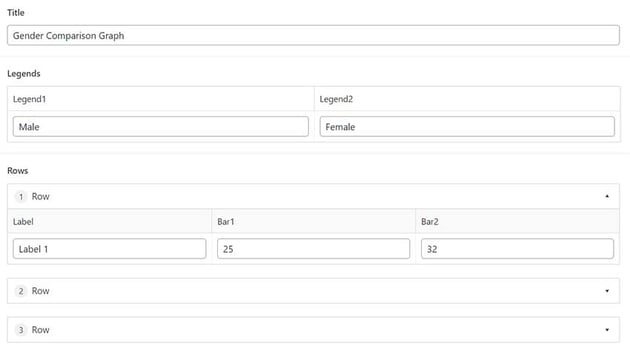
After setting the fields, we’ll navigate to the admin of the target page and fill them with data.
In the single-chart.php file, we already have a reference to the required canvas element that Chart.js expects:
1 |
<?php
|
2 |
/*
|
3 |
Template Name: Single Chart Page
|
4 |
*/
|
5 |
get_header(); |
6 |
?>
|
7 |
|
8 |
<main class="site-main"> |
9 |
<?php
|
10 |
if ( have_posts() ) : |
11 |
while ( have_posts() ) : |
12 |
the_post(); |
13 |
?>
|
14 |
<article id="post-<?php the_ID(); ?>" <?php post_class(); ?>> |
15 |
<div class="container my-5"> |
16 |
<canvas id="myChart"></canvas> |
17 |
</div>
|
18 |
</article>
|
19 |
<?php
|
20 |
endwhile; |
21 |
endif; |
22 |
?>
|
23 |
</main>
|
24 |
|
25 |
<?php
|
26 |
get_footer(); |
From there, we’ll switch to the functions.php file and create a function, which will run only for pages whose template is the Single Chart Page one, for generating the chart data in the desired format:
1 |
function get_single_chart() { |
2 |
$chart_single = (object) array( |
3 |
'legends' => (object) array(), |
4 |
'labels' => array(), |
5 |
'bars' => (object) array( |
6 |
'bar1' => array(), |
7 |
'bar2' => array(), |
8 |
),
|
9 |
'title' => '', |
10 |
);
|
11 |
$chart = get_field( 'chart' ); |
12 |
$chart_legends = $chart['legends']; |
13 |
|
14 |
$chart_single->title = esc_html( $chart['title'] ); |
15 |
$chart_single->legends->legend1 = esc_html( $chart_legends['legend1'] ); |
16 |
$chart_single->legends->legend2 = esc_html( $chart_legends['legend2'] ); |
17 |
|
18 |
foreach ( $chart['rows'] as $row ) : |
19 |
array_push( $chart_single->labels, esc_html( $row['label'] ) ); |
20 |
array_push( $chart_single->bars->bar1, esc_html( $row['bar1'] ) ); |
21 |
array_push( $chart_single->bars->bar2, esc_html( $row['bar2'] ) ); |
22 |
endforeach; |
23 |
|
24 |
return $chart_single; |
25 |
}
|
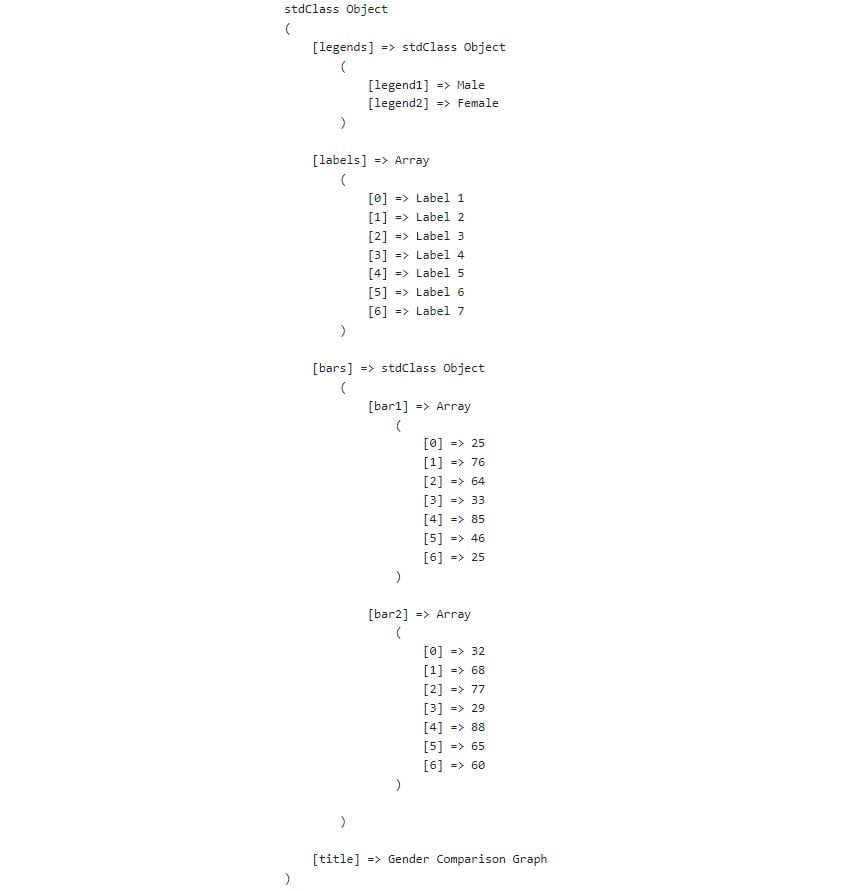
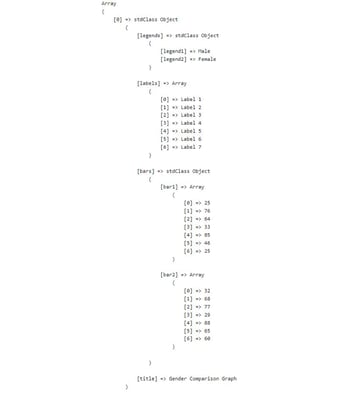
For simplicity, we’ll skip additional checks like ensuring that the rows array isn’t empty, etc.
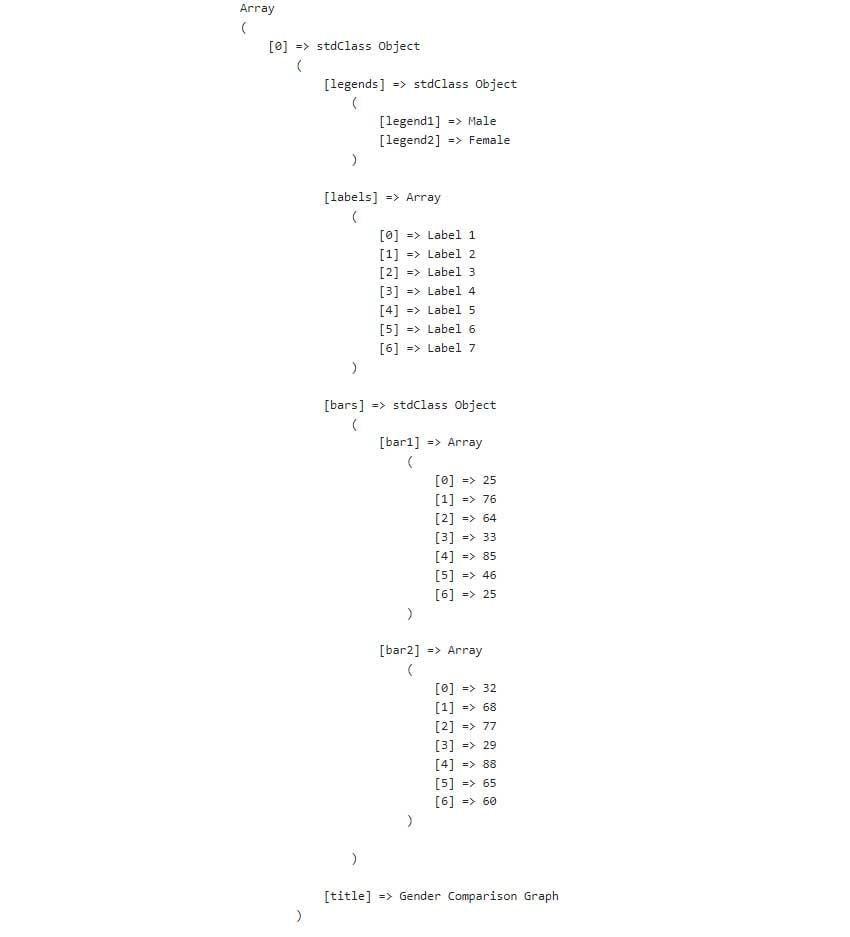
Here’s an example of the generated data:
We’ll pass these data through the wp_localize_script() function with the help of the global_obj object to the associated JavaScript file.
1 |
function playground_scripts_and_styles() { |
2 |
...
|
3 |
if ( is_page_template( 'page-templates/single-chart.php' ) ) : |
4 |
wp_enqueue_script( 'playground-script-single-chart', $theme_uri . '/assets/js/single-chart.js', array(), null, true ); |
5 |
wp_localize_script( |
6 |
'playground-script-single-chart', |
7 |
'global_obj', |
8 |
array( |
9 |
'chart' => get_single_chart(), |
10 |
)
|
11 |
);
|
12 |
endif; |
13 |
}
|
14 |
add_action( 'wp_enqueue_scripts', 'playground_scripts_and_styles' ); |
Next, in the single-chart.js file, we’ll grab the PHP data using the global_obj.chart property and print the vertical bar chart with the following code:
1 |
Chart.defaults.font.family = "Poppins, sans-serif"; |
2 |
Chart.defaults.color = "#073b4c"; |
3 |
|
4 |
const chart = global_obj.chart; |
5 |
|
6 |
const data = { |
7 |
labels: chart.labels, |
8 |
datasets: [ |
9 |
{
|
10 |
label: chart.legends.legend1, |
11 |
data: chart.bars.bar1, |
12 |
backgroundColor: "#dc3545", |
13 |
},
|
14 |
{
|
15 |
label: chart.legends.legend2, |
16 |
data: chart.bars.bar2, |
17 |
backgroundColor: "#198754", |
18 |
},
|
19 |
],
|
20 |
};
|
21 |
|
22 |
const config = { |
23 |
type: "bar", |
24 |
data, |
25 |
options: { |
26 |
plugins: { |
27 |
title: { |
28 |
display: true, |
29 |
text: chart.title, |
30 |
position: "top", |
31 |
font: { |
32 |
size: 25, |
33 |
},
|
34 |
padding: { |
35 |
top: 15, |
36 |
bottom: 15, |
37 |
},
|
38 |
},
|
39 |
legend: { |
40 |
position: "bottom", |
41 |
labels: { |
42 |
padding: 30, |
43 |
font: { |
44 |
size: 14, |
45 |
},
|
46 |
},
|
47 |
},
|
48 |
tooltip: { |
49 |
enabled: false, |
50 |
},
|
51 |
},
|
52 |
scales: { |
53 |
y: { |
54 |
ticks: { |
55 |
crossAlign: "left", |
56 |
callback: function (val) { |
57 |
return `${val}%`; |
58 |
},
|
59 |
},
|
60 |
},
|
61 |
},
|
62 |
},
|
63 |
};
|
64 |
|
65 |
const ctx = document.getElementById("myChart").getContext("2d"); |
66 |
new Chart(ctx, config); |
Integrate Bootstrap Tabs With Charts
Let’s now go a step further and recreate the layout of the previous tutorial.


Using ACF, we’ll create a new flexible content field and map it to the page we want—in my case, this will be the page with the Tabs Page template.
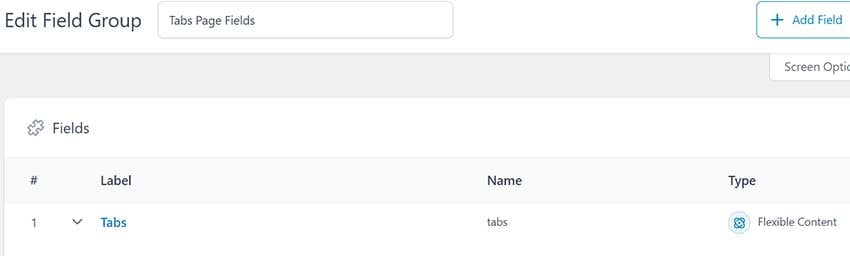
For each tab, we’ll define two fields: its name and the data for the embedded chart.
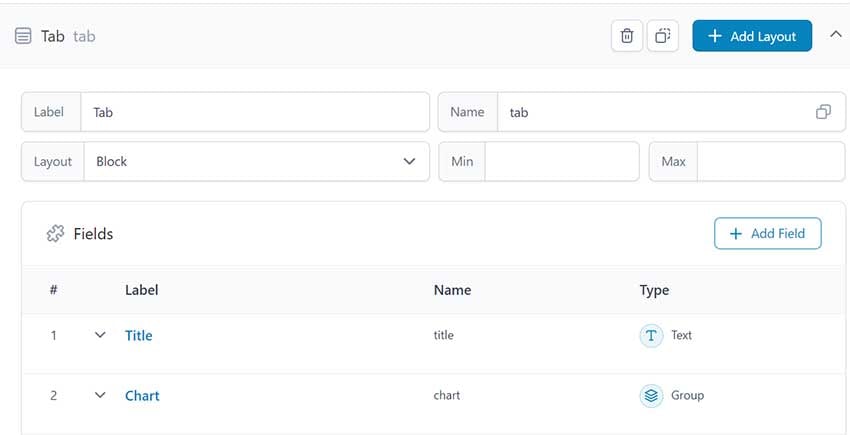

The sub-fields of the Chart group field are the same as the fields of the Chart group field of the Single Chart Page template.
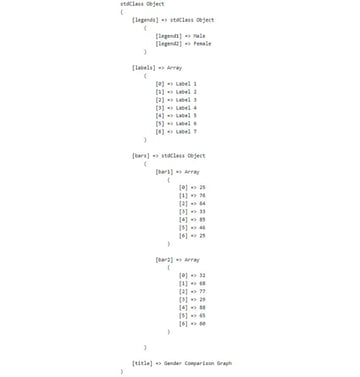
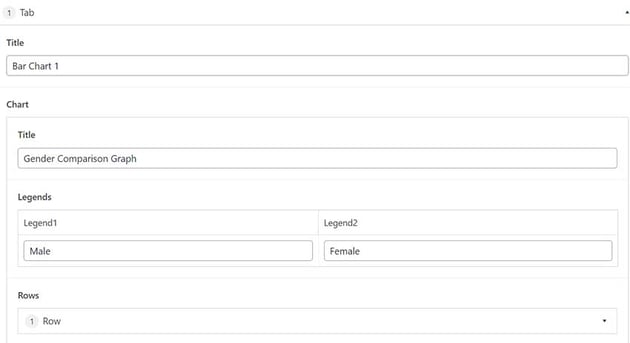
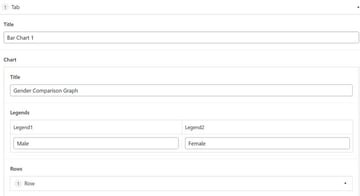
After setting the fields, we’ll navigate to the admin of the target page and create as many tabs as we want.
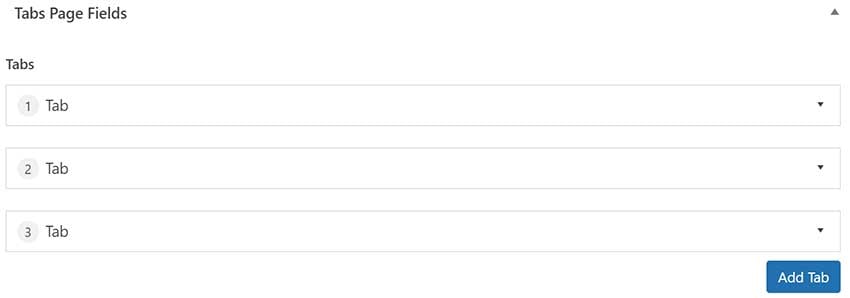


Each tab will look like this:
In the tabs.php file, we’ll loop through the tabs, and for each one, we’ll create the appropriate canvas element that Chart.js expects:
1 |
<?php
|
2 |
/*
|
3 |
Template Name: Tabs Page
|
4 |
*/
|
5 |
get_header(); |
6 |
?>
|
7 |
|
8 |
<main class="site-main"> |
9 |
<?php
|
10 |
if ( have_posts() ) : |
11 |
while ( have_posts() ) : |
12 |
the_post(); |
13 |
$tabs = get_field( 'tabs' ); |
14 |
?>
|
15 |
<article id="post-<?php the_ID(); ?>" <?php post_class(); ?>> |
16 |
<div class="container my-5"> |
17 |
<ul class="nav nav-tabs" id="myTab" role="tablist"> |
18 |
<?php
|
19 |
foreach ( $tabs as $key => $tab ) : |
20 |
$active_class = 0 === $key ? ' active' : ''; |
21 |
$aria_selected = 0 === $key ? true : false; |
22 |
$number = ++$key; |
23 |
?>
|
24 |
<li class="nav-item" role="presentation"> |
25 |
<button class="nav-link<?php echo $active_class; ?>" id="chart<?php echo $number; ?>-tab" data-bs-toggle="tab" data-bs-target="#chart<?php echo $number; ?>-tab-pane" type="button" role="tab" aria-controls="chart<?php echo $number; ?>-tab-pane" aria-selected="<?php echo $aria_selected; ?>"> |
26 |
<?php echo esc_html( $tab['title'] ); ?> |
27 |
</button>
|
28 |
</li>
|
29 |
<?php endforeach; ?> |
30 |
</ul>
|
31 |
<div class="tab-content mt-5" id="myTabContent"> |
32 |
<?php
|
33 |
foreach ( $tabs as $key => $tab ) : |
34 |
$active_class = 0 === $key ? ' show active' : ''; |
35 |
$number = ++$key; |
36 |
?>
|
37 |
<div class="tab-pane fade<?php echo $active_class; ?>" id="chart<?php echo $number; ?>-tab-pane" role="tabpanel" aria-labelledby="chart<?php echo $number; ?>-tab" tabindex="0"> |
38 |
<canvas id="myChart<?php echo $number; ?>"></canvas> |
39 |
</div>
|
40 |
<?php endforeach; ?> |
41 |
</div>
|
42 |
</div>
|
43 |
</article>
|
44 |
<?php
|
45 |
endwhile; |
46 |
endif; |
47 |
?>
|
48 |
</main>
|
49 |
|
50 |
<?php
|
51 |
get_footer(); |
From there, we’ll switch to the functions.php file and create a function, which will run only for pages whose template is the Tabs Page one, for generating the chart data in the desired format:
1 |
function get_multiple_charts() { |
2 |
$charts = array(); |
3 |
$tabs = get_field( 'tabs' ); |
4 |
foreach ( $tabs as $tab ) : |
5 |
$chart_single = (object) array( |
6 |
'legends' => (object) array(), |
7 |
'labels' => array(), |
8 |
'bars' => (object) array( |
9 |
'bar1' => array(), |
10 |
'bar2' => array(), |
11 |
),
|
12 |
'title' => '', |
13 |
);
|
14 |
$chart = $tab['chart']; |
15 |
$chart_legends = $chart['legends']; |
16 |
|
17 |
$chart_single->title = esc_html( $chart['title'] ); |
18 |
$chart_single->legends->legend1 = esc_html( $chart_legends['legend1'] ); |
19 |
$chart_single->legends->legend2 = esc_html( $chart_legends['legend2'] ); |
20 |
|
21 |
foreach ( $chart['rows'] as $row ) : |
22 |
array_push( $chart_single->labels, esc_html( $row['label'] ) ); |
23 |
array_push( $chart_single->bars->bar1, esc_html( $row['bar1'] ) ); |
24 |
array_push( $chart_single->bars->bar2, esc_html( $row['bar2'] ) ); |
25 |
endforeach; |
26 |
array_push( $charts, $chart_single ); |
27 |
endforeach; |
28 |
|
29 |
return $charts; |
30 |
}
|
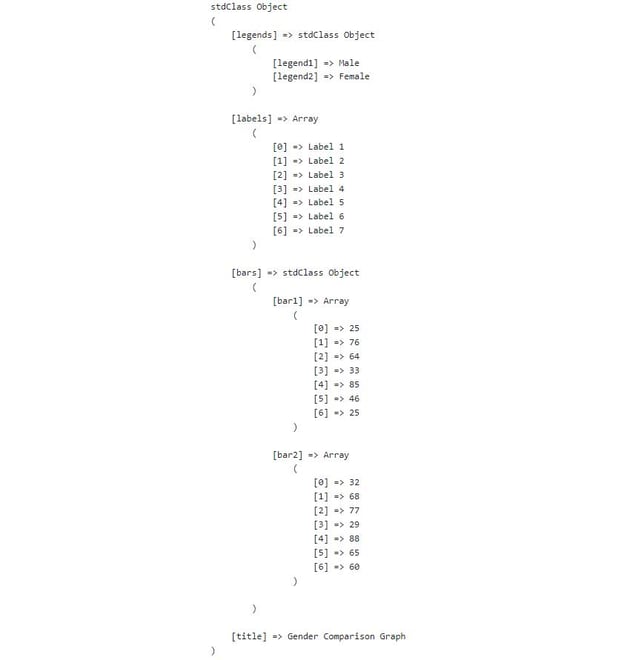
Again, for simplicity, we’ll skip additional checks like ensuring that the rows array isn’t empty, etc.
Here’s an example of the generated data:
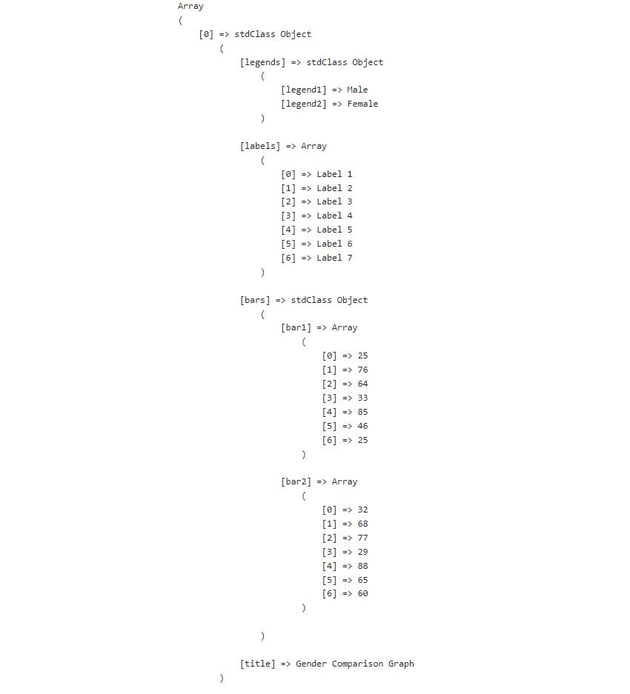
We’ll pass these data through the wp_localize_script() function with the help of the global_obj object to the associated JavaScript file.
1 |
function playground_scripts_and_styles() { |
2 |
...
|
3 |
if ( is_page_template( 'page-templates/tabs.php' ) ) : |
4 |
wp_enqueue_script( 'playground-script-multiple-charts', $theme_uri . '/assets/js/multiple-charts.js', array(), null, true ); |
5 |
wp_localize_script( |
6 |
'playground-script-multiple-charts', |
7 |
'global_obj', |
8 |
array( |
9 |
'charts' => get_multiple_charts(), |
10 |
)
|
11 |
);
|
12 |
endif; |
13 |
}
|
14 |
add_action( 'wp_enqueue_scripts', 'playground_scripts_and_styles' ); |
Next, in the multiple-charts.js file, we’ll grab the PHP data using the global_obj.charts property and print the vertical bar charts with the same code we used in the previous tutorial.
1 |
const tabEls = document.querySelectorAll('button[data-bs-toggle="tab"]'); |
2 |
|
3 |
Chart.defaults.font.family = "Poppins, sans-serif"; |
4 |
Chart.defaults.color = "#073b4c"; |
5 |
|
6 |
initializeSingleChart(0); |
7 |
|
8 |
tabEls.forEach(function (tabEl) { |
9 |
tabEl.addEventListener("shown.bs.tab", function (event) { |
10 |
const index = Array.from(tabEls).indexOf(event.target); |
11 |
initializeSingleChart(index); |
12 |
});
|
13 |
});
|
14 |
|
15 |
function initializeSingleChart(index) { |
16 |
const chart = global_obj.charts[index]; |
17 |
const chartEl = `myChart${++index}`; |
18 |
const chartInstance = Chart.getChart(chartEl); |
19 |
|
20 |
if (chartInstance !== undefined) { |
21 |
chartInstance.destroy(); |
22 |
}
|
23 |
|
24 |
const data = { |
25 |
labels: chart.labels, |
26 |
datasets: [ |
27 |
{
|
28 |
label: chart.legends.legend1, |
29 |
data: chart.bars.bar1, |
30 |
backgroundColor: "#dc3545" |
31 |
},
|
32 |
{
|
33 |
label: chart.legends.legend2, |
34 |
data: chart.bars.bar2, |
35 |
backgroundColor: "#198754" |
36 |
}
|
37 |
]
|
38 |
};
|
39 |
|
40 |
const config = { |
41 |
type: "bar", |
42 |
data, |
43 |
options: { |
44 |
plugins: { |
45 |
title: { |
46 |
display: true, |
47 |
text: chart.title, |
48 |
position: "top", |
49 |
font: { |
50 |
size: 25 |
51 |
},
|
52 |
padding: { |
53 |
top: 15, |
54 |
bottom: 15 |
55 |
}
|
56 |
},
|
57 |
legend: { |
58 |
position: "bottom", |
59 |
labels: { |
60 |
padding: 30, |
61 |
font: { |
62 |
size: 14 |
63 |
}
|
64 |
}
|
65 |
},
|
66 |
tooltip: { |
67 |
enabled: false |
68 |
}
|
69 |
},
|
70 |
scales: { |
71 |
y: { |
72 |
ticks: { |
73 |
crossAlign: "left", |
74 |
callback: function (val) { |
75 |
return `${val}%`; |
76 |
}
|
77 |
}
|
78 |
}
|
79 |
}
|
80 |
}
|
81 |
};
|
82 |
|
83 |
const ctx = document.getElementById(chartEl).getContext("2d"); |
84 |
new Chart(ctx, config); |
85 |
}
|
Conclusion
Done! That was a really big tutorial folks, but I hope that you’ve learned a lot and now have a good understanding of how to embed Chart.js charts in WordPress in custom layouts without having to embed a WordPress chart plugin.
Of course, here we worked with the Bootstrap framework and the ACF plugin, but the methodology remains the same regardless of the front-end/CSS framework or fields plugin you’re going to use.
As always, thanks a lot for reading!