Design can be considered a craftsmanship because you do it until you are good at it and then you keep doing it to be better. The problem is that many developers are really eager to solve functionality problems rather than spending time to solve the interface issues.
A mobile designer must embrace minimalism because he will have to limit the features available on each screen and use them efficiently. Of course, the designer must also pay a lot of attention to usability. If a function cannot be found, is to small to notice, or not large enough to be used, the application becomes unusable.
Designing for mobile seems like a difficult move from designing for web or for desktop applications and a designer must keep an eye on almost everything that he can think of and on what he doesn’t know yet. Seems like a lot of pressure meaning that there’s little time left for imagining how to make the required elements of mobile UI design.
The charts and graphs which are displayed in this article for inspiration should help a mobile app designer to expand his imagination and relieve some of the stress that he comes across while designing an app.
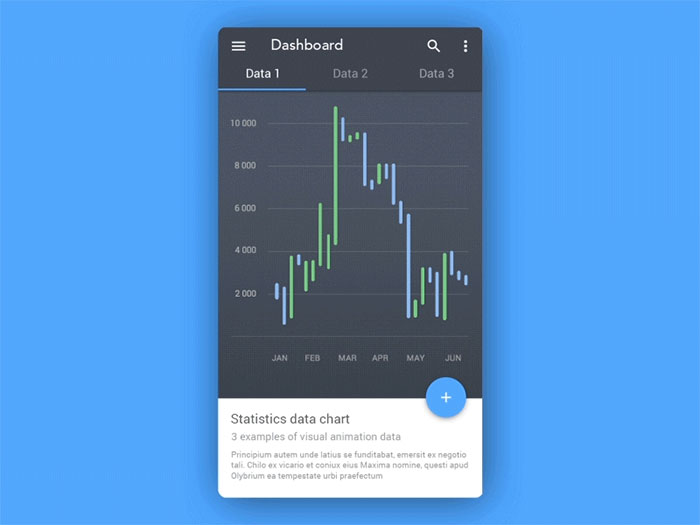
Android – Statistics Data Chart
Arco’s charts and graphs
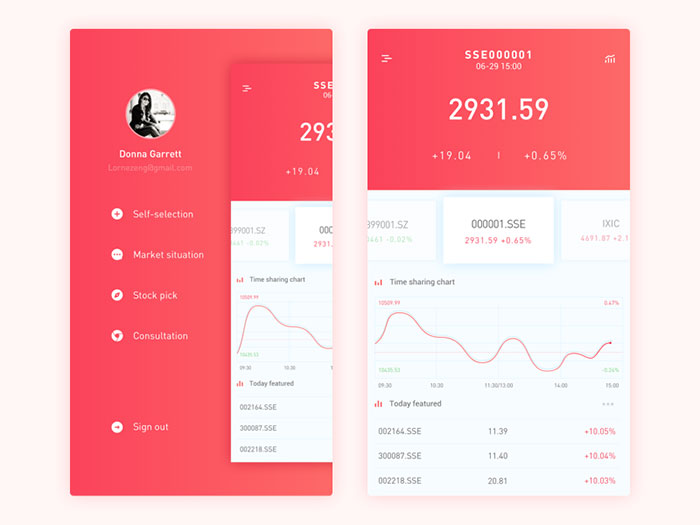
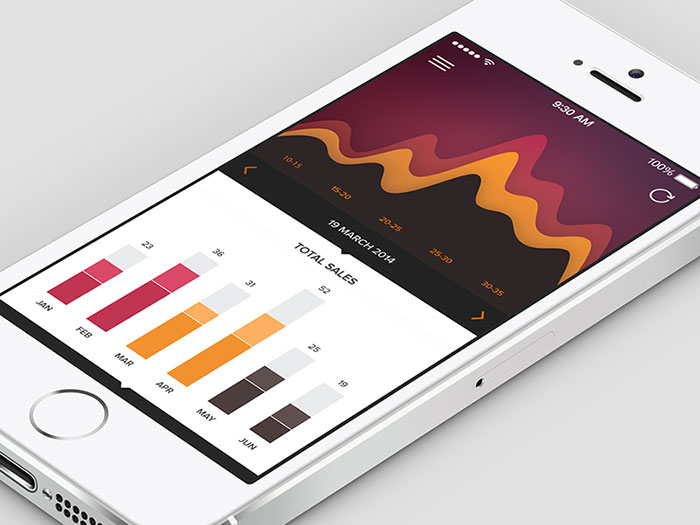
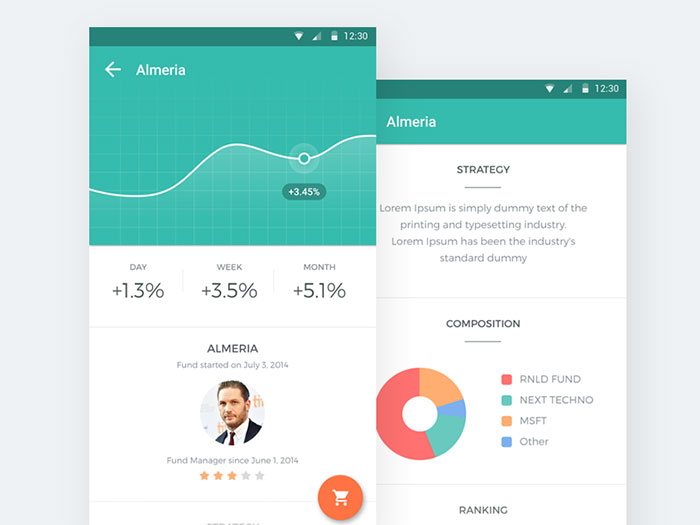
Stock App Design
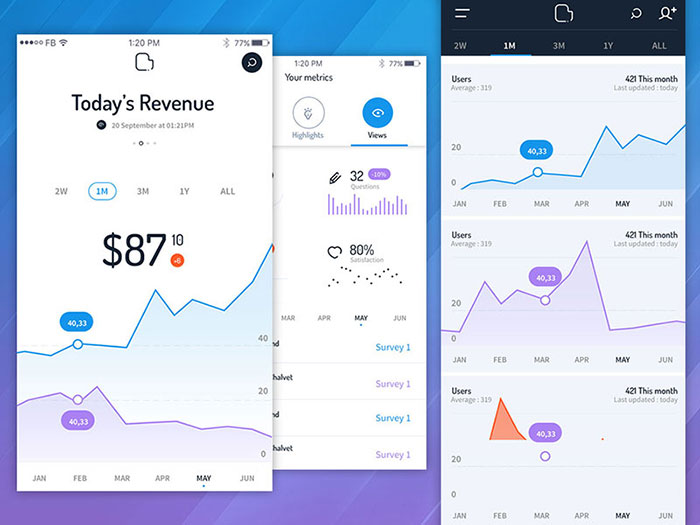
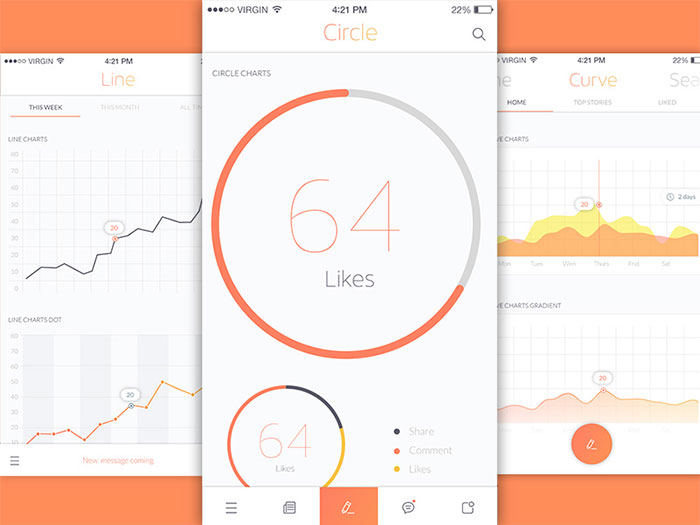
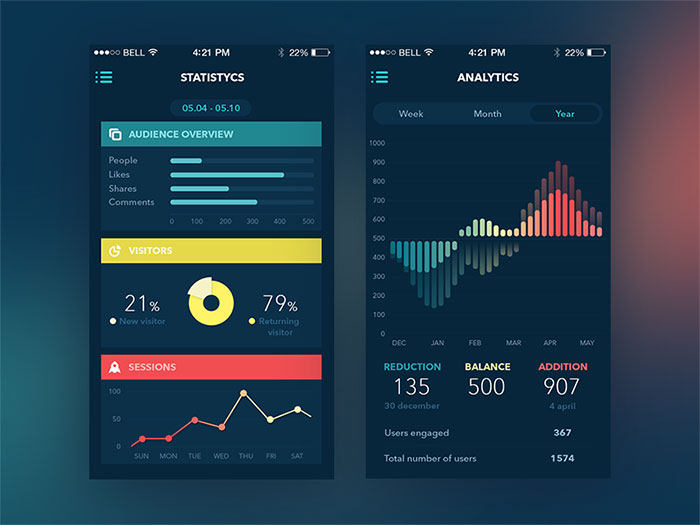
Analytics
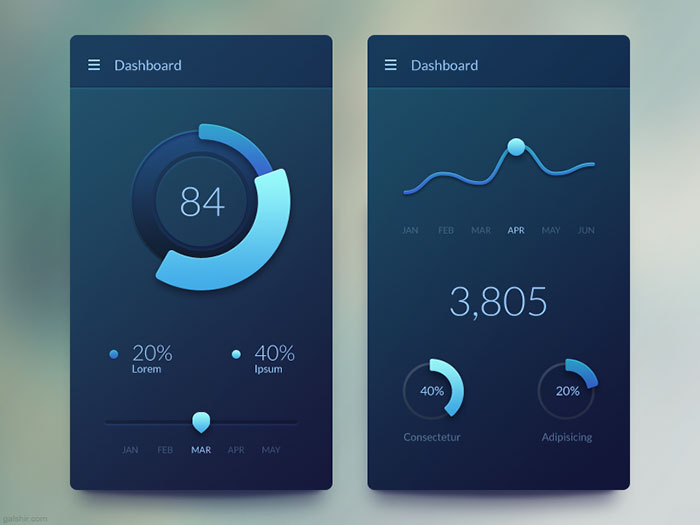
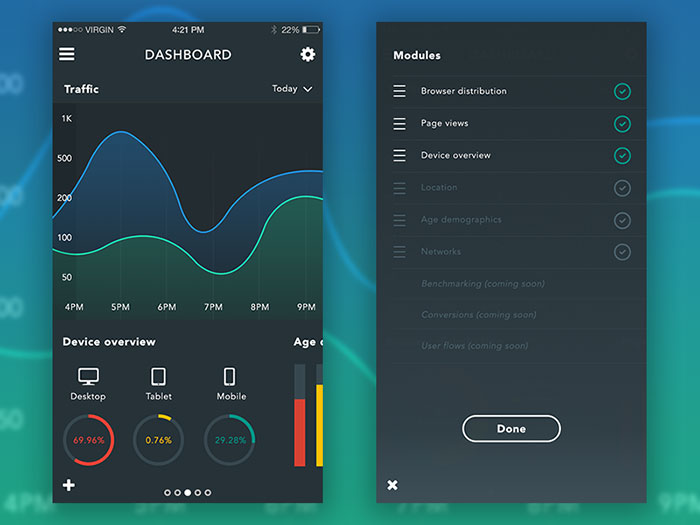
Mobile Dashboard
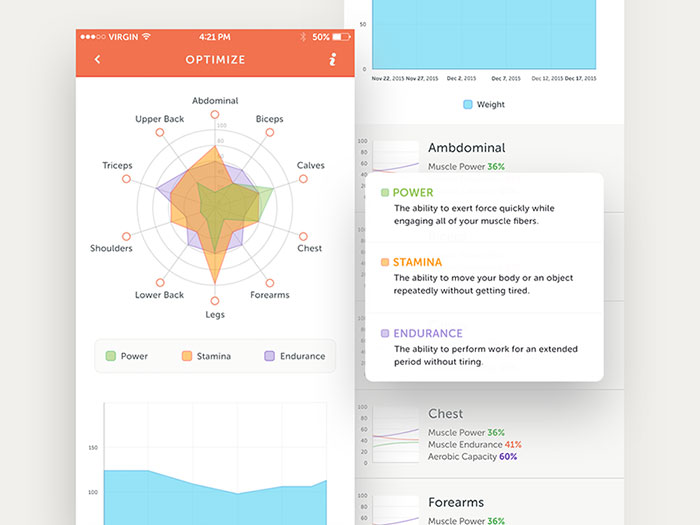
Optimize – Stats
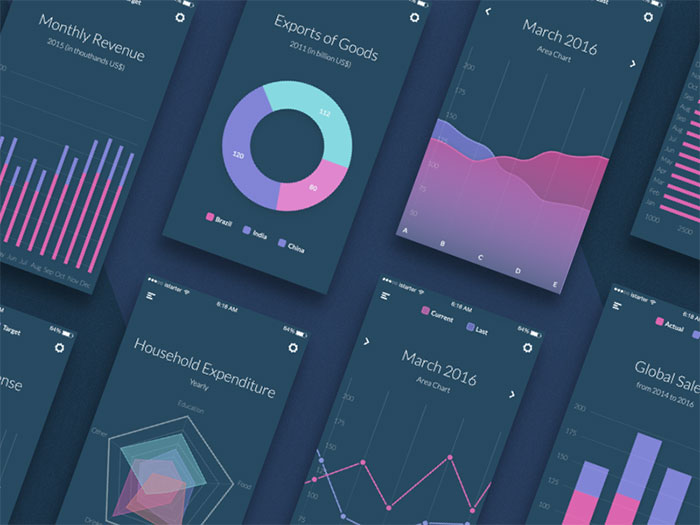
Charts and graphs in mobile UI
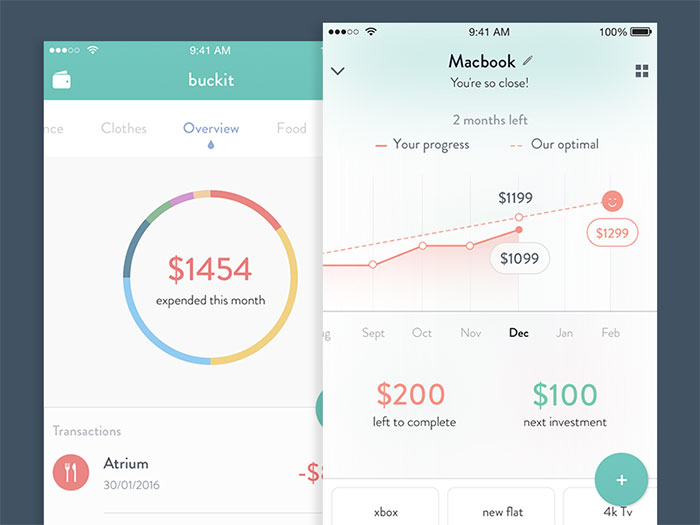
Buckit financial app
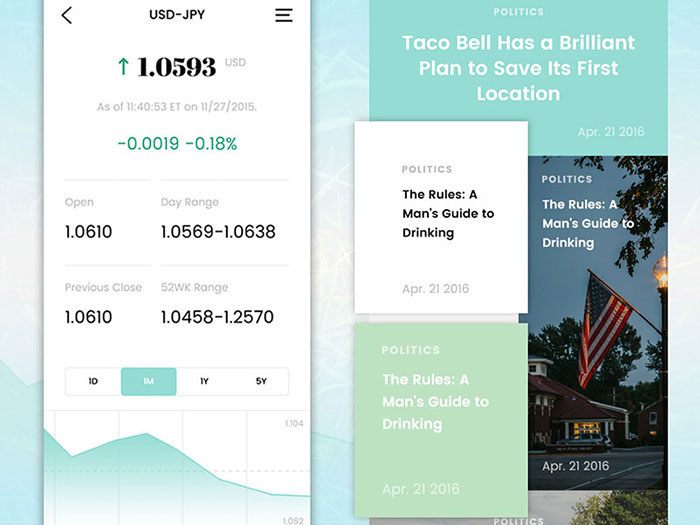
Financial and news app screens
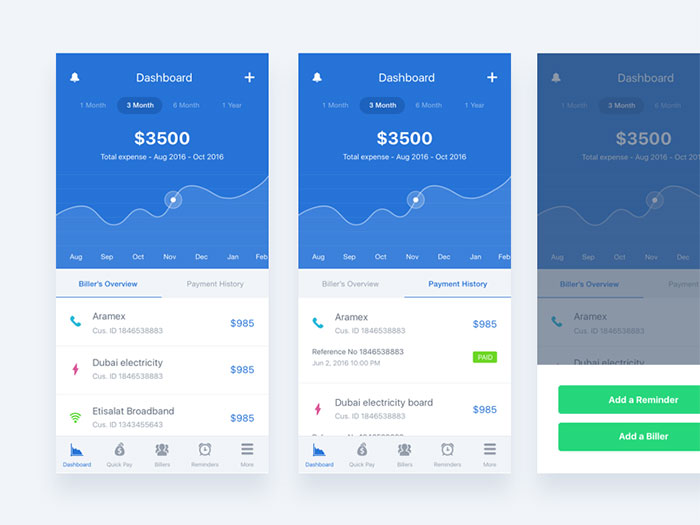
Pay Bills
Line Graph Screen
Analytics app screens
Analytics App
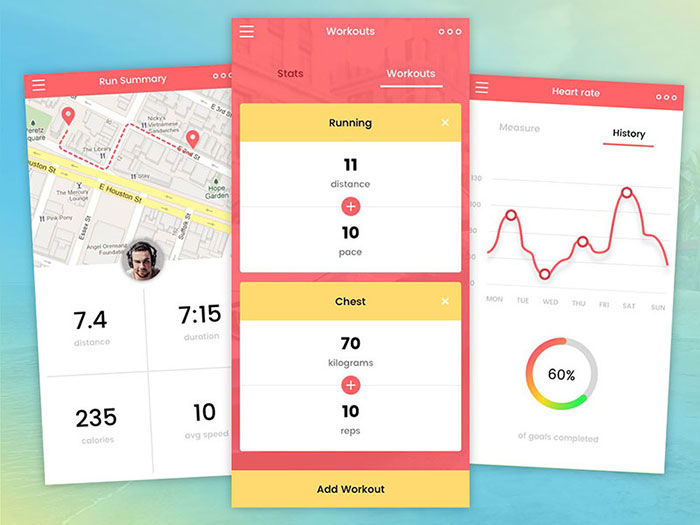
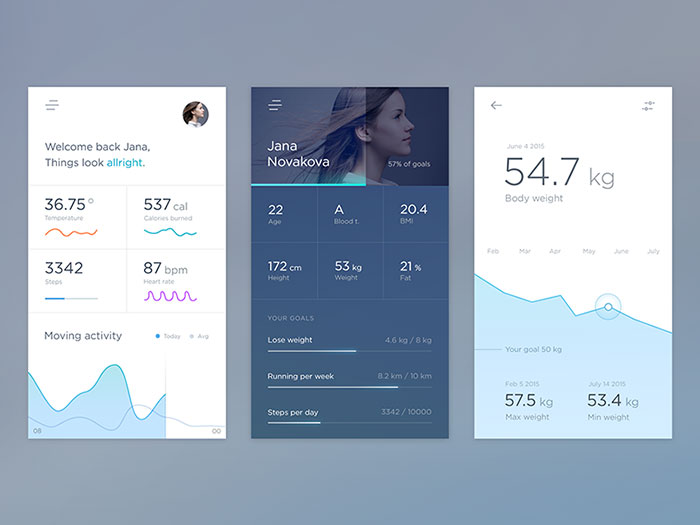
Health App mobile
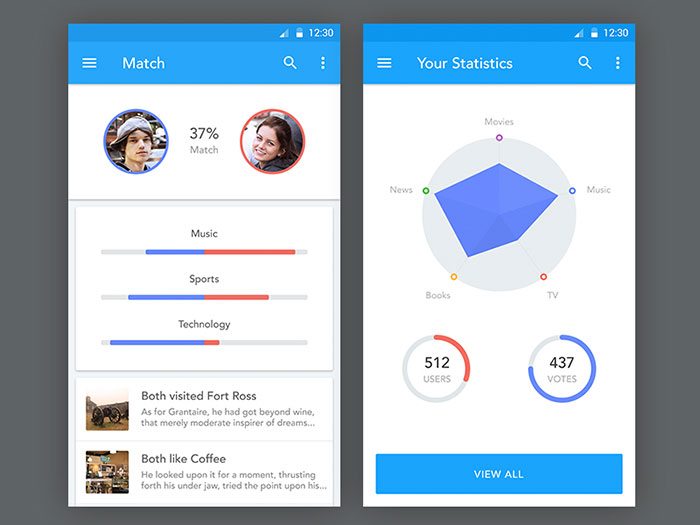
Cycling Match
Threat Dashboard Direction iOS
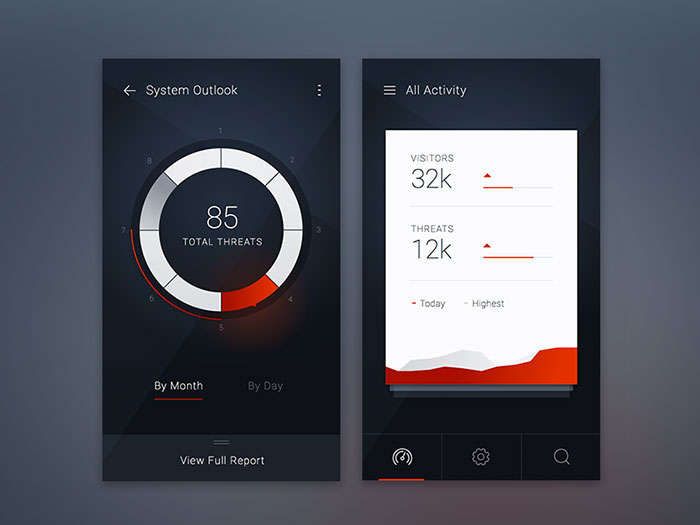
Mobile dashboard
Charts
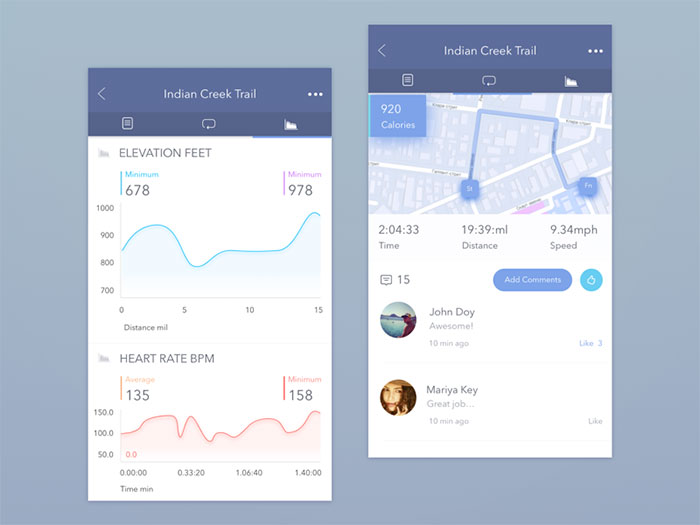
Indian Creek Trail App Concept
Manage modules
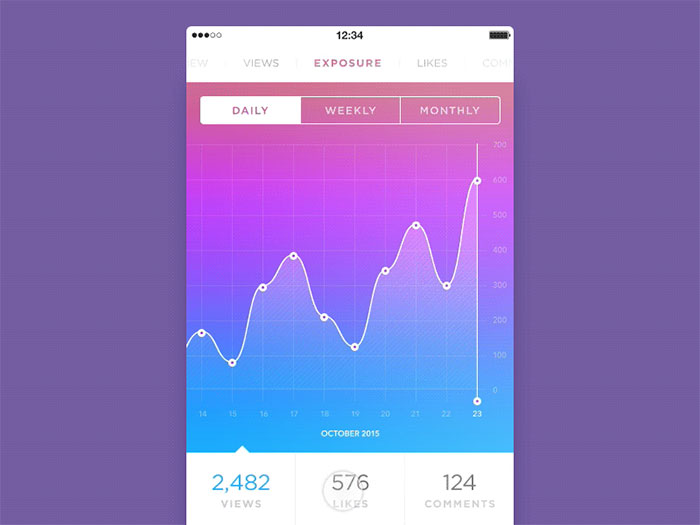
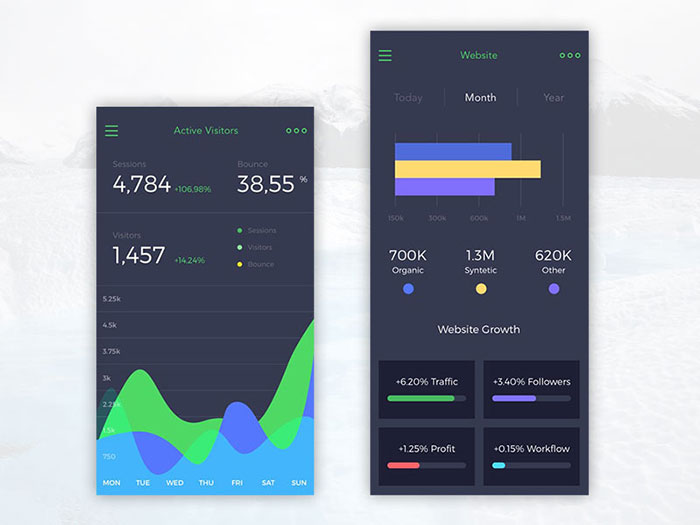
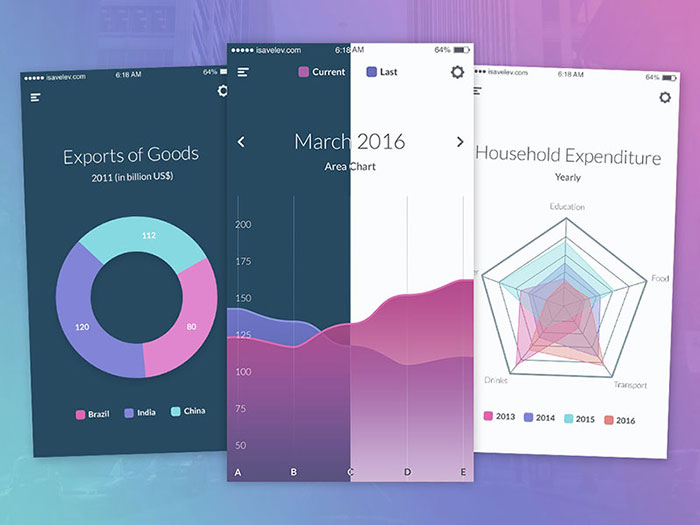
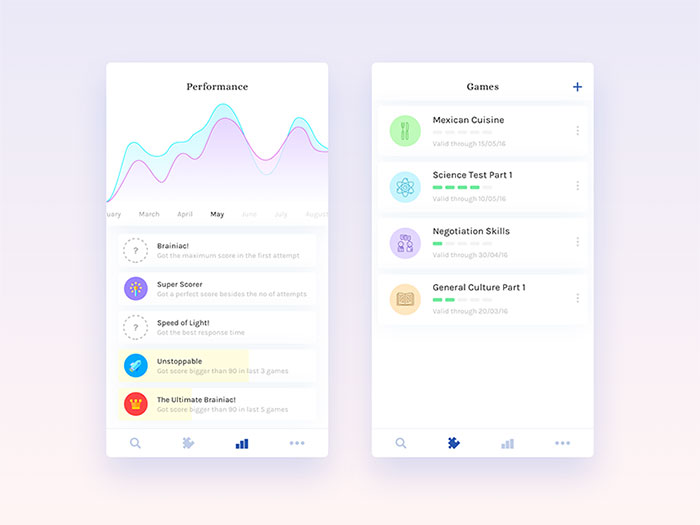
Purple charts and graphs
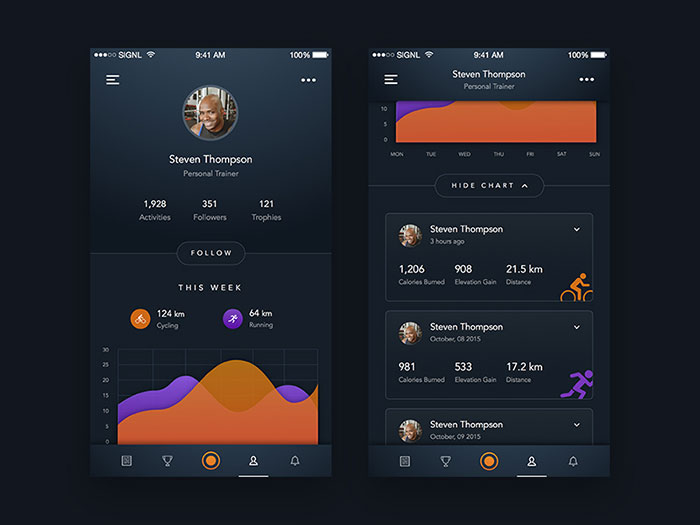
Sport Tracking App – Profile
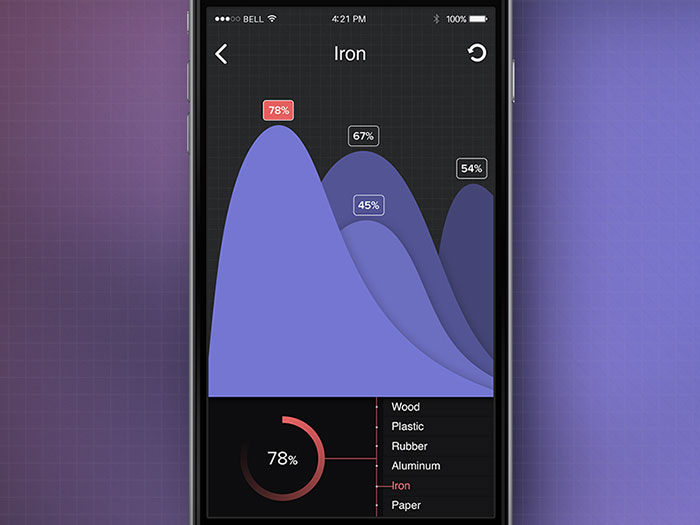
Iron Chart
Noblyn App Redesign
Mobile Investment Platform
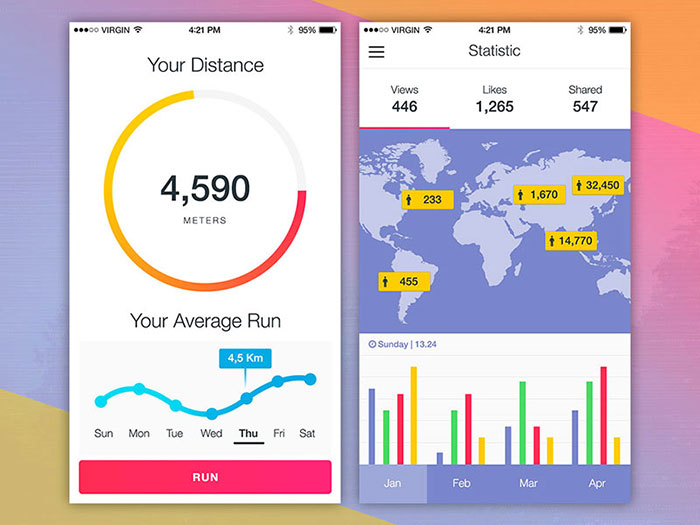
Tracking app