Of course, it’s great that you already store the results of your research in a place where others can find them. A folder of reports (in Sharepoint), a wiki (like Notion or Confluence), or maybe even a dedicated research repository (like Dovetail, Reveall, or EnjoyHQ). Sharing your findings in such a way will help in making your conclusions more accessible. But does it help you as a researcher?

In this article, I’m hoping to convince you to create a library of your tagged and anonymized research data. Data like interview notes, web analytics, survey-data, customer feedback, screen recordings, etcetera.
The article has two parts: why you should build an information library, and how you can build one.
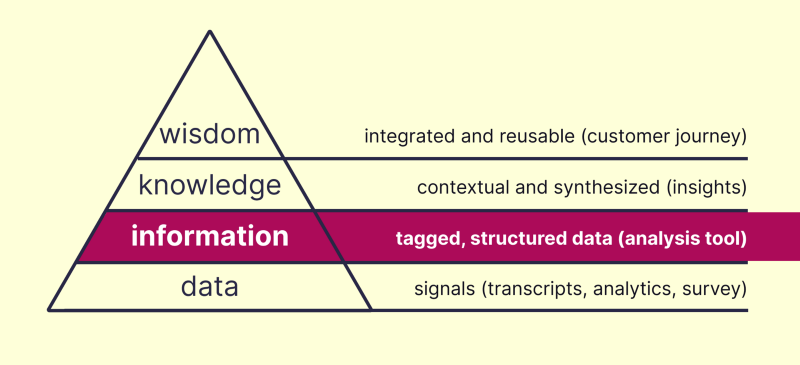
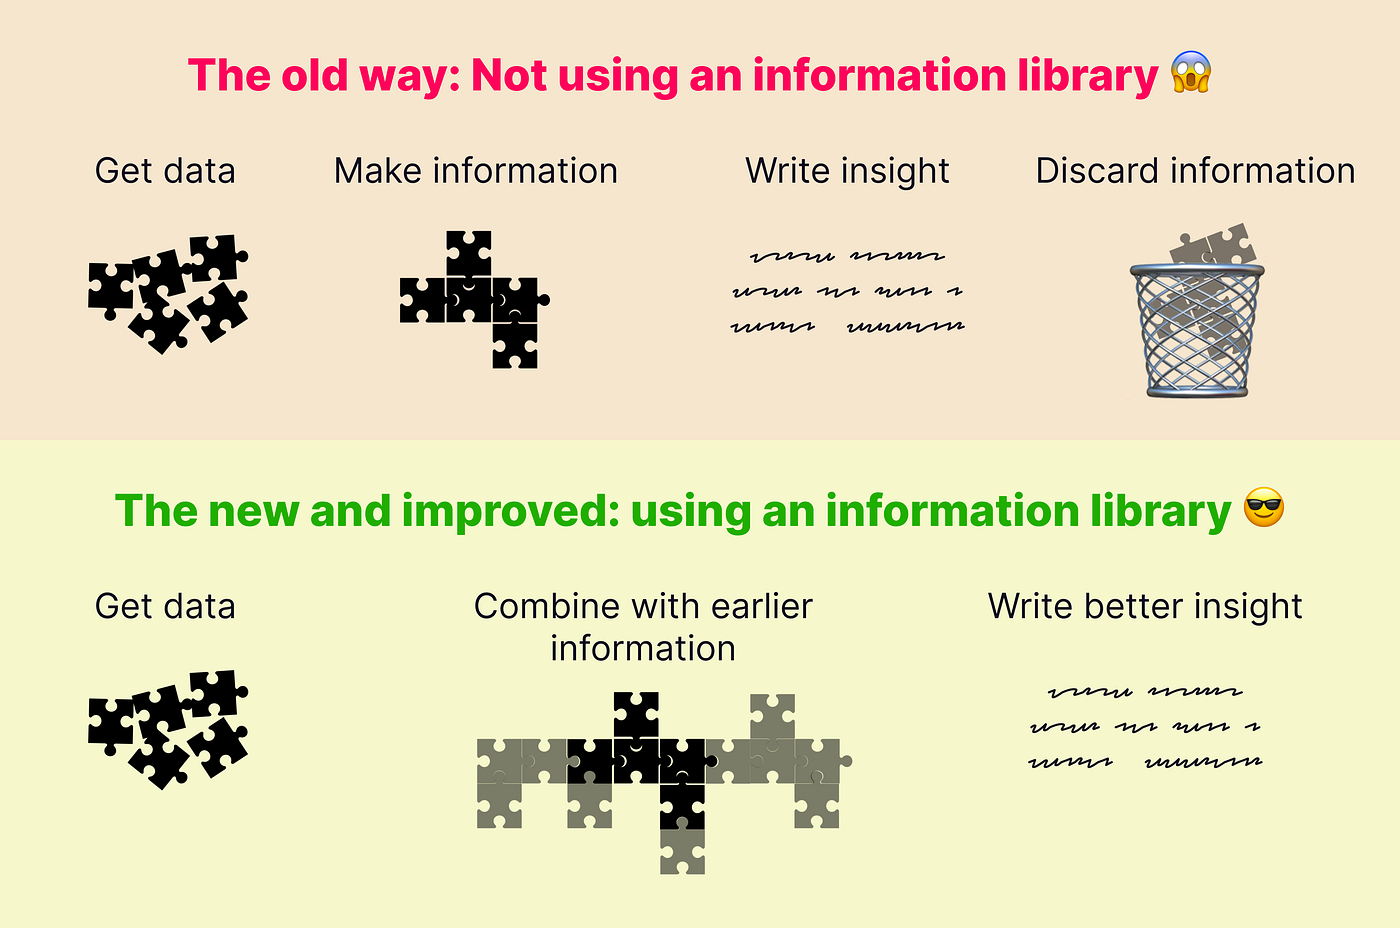
Research has four simple steps: 1. gather data, 2. process data (so it becomes information), 3. write conclusions, 4. share conclusions. And then we move on to the next research project, where we do all four steps again. What do we do with our information (processed data)? We forget about it, and that is a shame!
I see five reasons to make an information library:
- answer questions quicker
- cheaper research
- better insights
- discover hidden insights
- research together across silos
Reason 1: Answer questions quicker
Maybe a stakeholder read your report, and asks “which people did say this?”. If you didn’t keep your tagged data, this answer might be difficult to give.
But with an information library, you can dig deeper back into your research, even years later.
Reason 2: Cheaper research
With an information library, you can reuse previous data for new conclusions. This is very powerful.
Let’s say you want to know how people use a certain feature of your platform, perhaps printing. Before doing any new research, you can use your information library to dig back in previous interviews, surveys and feedback to find a hint of an answer already.
It’s an incredibly cheap way to do research. Cheap, but still very powerful as you draw on a lot of data points.
And if there are gaps in your conclusions, your information library gave you the information you needed to set up a more detailed research plan.
Reason 3: Wow, triangulation for free! 🤩
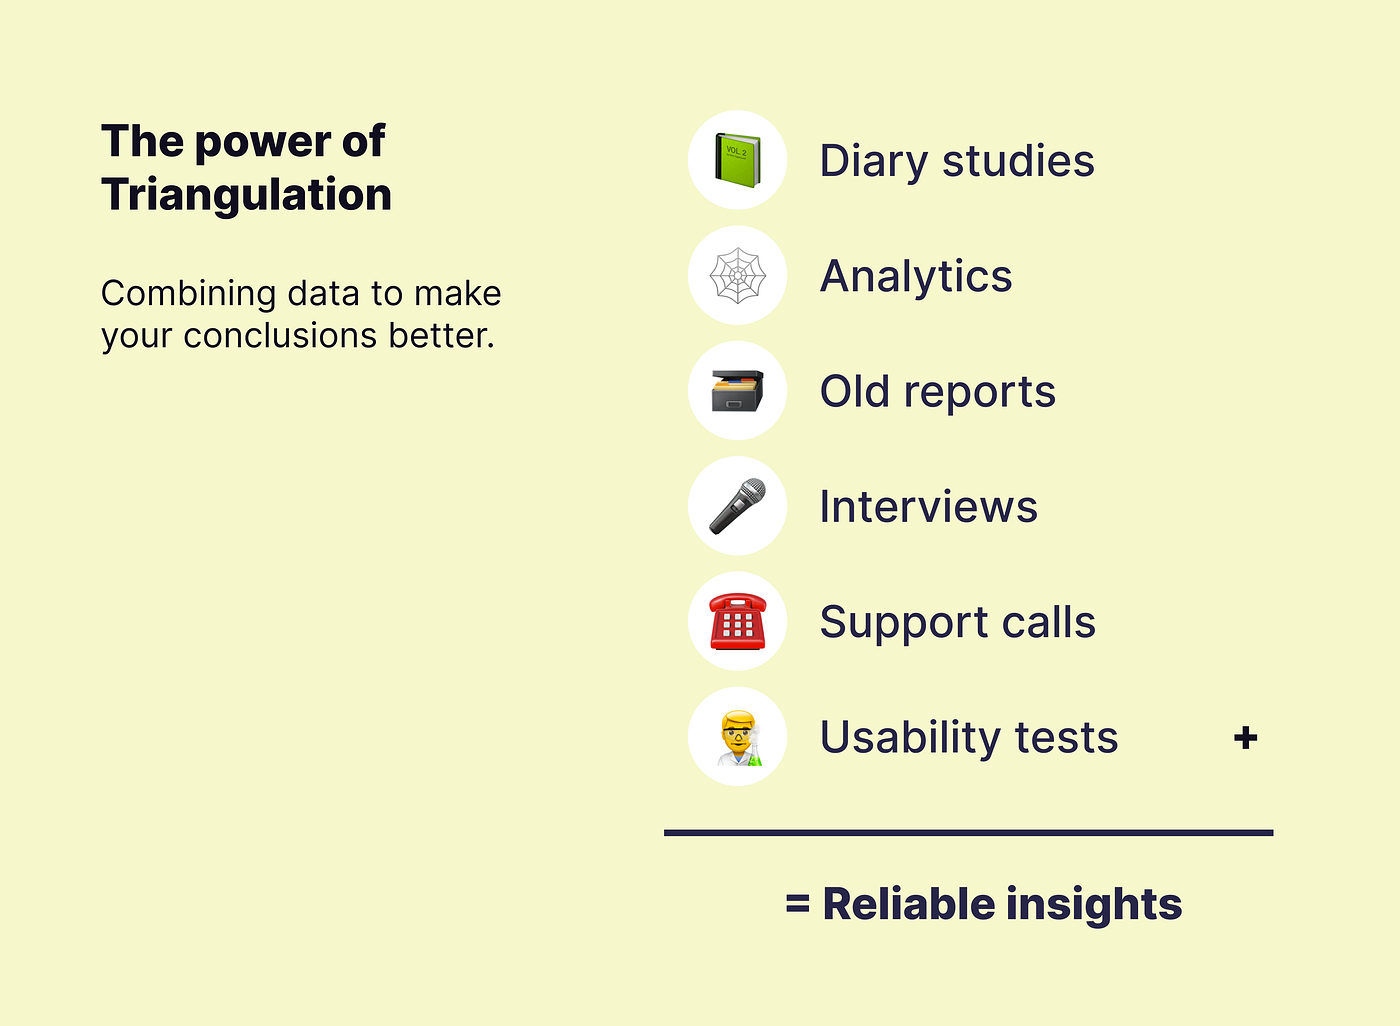
Triangulation simply means diversity in research. Using multiple methods to collect data, using data from different timeframes, varying research-frameworks and doing analysis by different researchers.
By using triangulation you get a broader, deeper and more nuanced understanding of the space your are investigating. Plus, it adds to the validity and credibility of your research.
Triangulation is normally very expensive: setting up a survey and rounds of interviews and do analytics and… Imagine getting the budget for that!
By maintaining a research-data-library you get all this yummy triangulation for free.
Example:
you find out with your analytics that some pages get printed more often than others and from customer feedback you find complaints about the printing feature. In the interview notes from usability tests you did earlier, some people mention why they sometimes print a page. You then dig a bit further in your library and find summaries of support calls, and interviews with account managers. Because you kept old screen recordings you can see what the exact usability problem is in certain browsers.You now have a complete story of what goes wrong with your printing function, why it goes wrong, how important it is and how you can fix it. And if you need to do more research to be sure, you know your target audience and which questions to ask them.
🤞 I’ll explain exactly how to do tagging a bit later in the article!
Reason 4: discover hidden insights
When you keep an information library, you will find insights that you wouldn’t have seen otherwise. These can be trends over time, subgroups in your target audiences, habits of users, etc.
The best thing is that this happens automatically. There is no need to do extra work: just keep tagging your data when you gather it (and thus processing it into information).
Example
Let’s say you interviewed twenty people in January and analyzed this qualitative data in your information library. Then you interview another twelve in May. And then another batch of sixteen in June. For each of these three sessions you draw conclusions that you shared with your stakeholders. Decisions are made, everybody really happy.But what’s this: a certain tag in your information library looks suspiciously big… It’s a new business opportunity that only a handful of people were talking about. You would never have connected these dots if you had kept all three research sessions separately!
Reason 5: research across silos
If you set up your information library in a new ‘research repository tool’ (like Dovetail, Aurelius, Condens or EnjoyHQ) you can tag data together with other people. Other UX-researchers, but also other people who do research or come into contact with your user group. For instance market-researcher, sales, your support, channel-managers and service designers.
With an information library, you have the power of all data behind your conclusions. And so do other people in your organization. This makes it easier to keep up to date with research across the silos in your organization.

So yeah, an information library is cool. But how do you build an information library?
I have done this in Dovetail (more specifically Dovetail Markup), but there are alternatives: EnjoyHQ, Aurelius and Condens. I recommend making a free account with all four tools and do a quick qualitative analysis: just add tags to one of your existing interview transcripts, and find out which tool feels right for you.
Here are the steps to create an information library in Dovetail:
1. Create a new project
You will need a research project. This one project will contain all of your research. Later (i.e.: when you start paying (a lot more) for Dovetail) you can create separate projects and use a feature called “extensions”. For now, we’ll just hack something together 🤓
2.Create tag boards
Tag boards hold all of the tags you will use to create information (structure) out of your raw data.
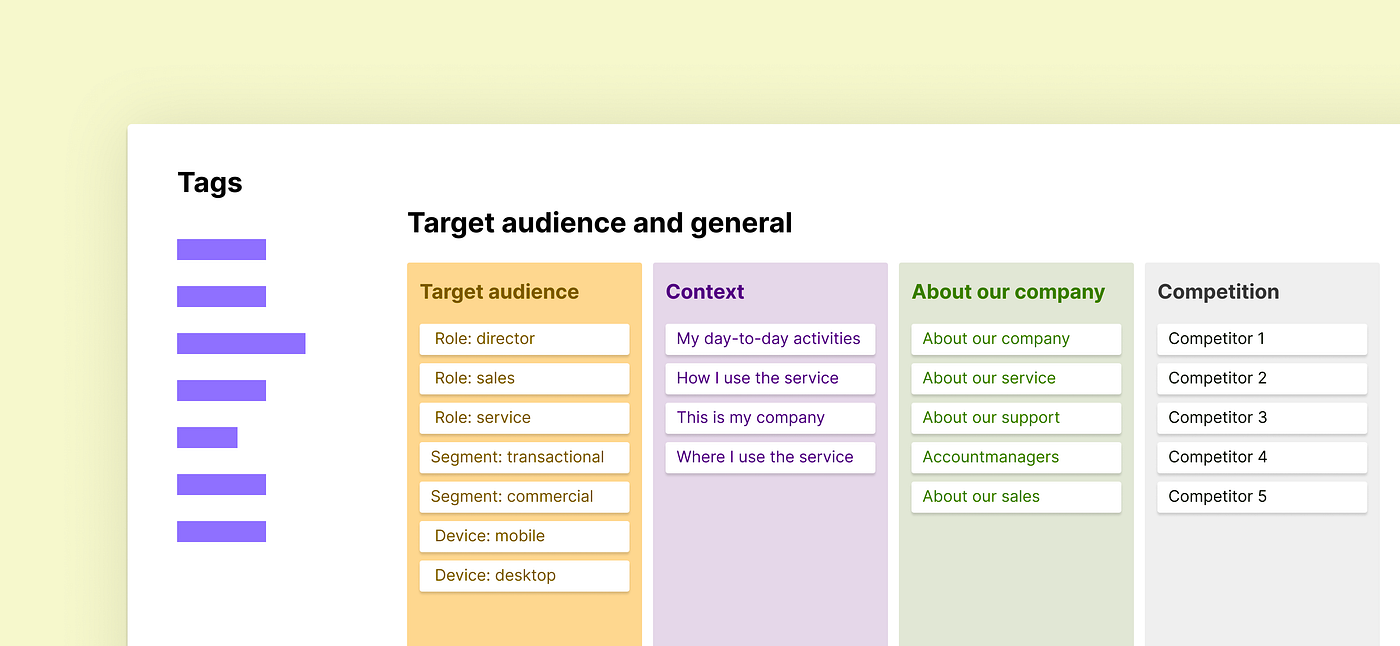
Create a tag board called “Target audience and general”. Add a column (called “tag group”) here with ’Target audience’, ‘Context’, ‘About our company’, and ‘Competition’. Fill these with some starter tags (you can always add more later).
Create a tag board per product or service your company sells. Add columns per page or feature you have. If you have a very important flow in your product, you can create a separate tag board for this flow as well.
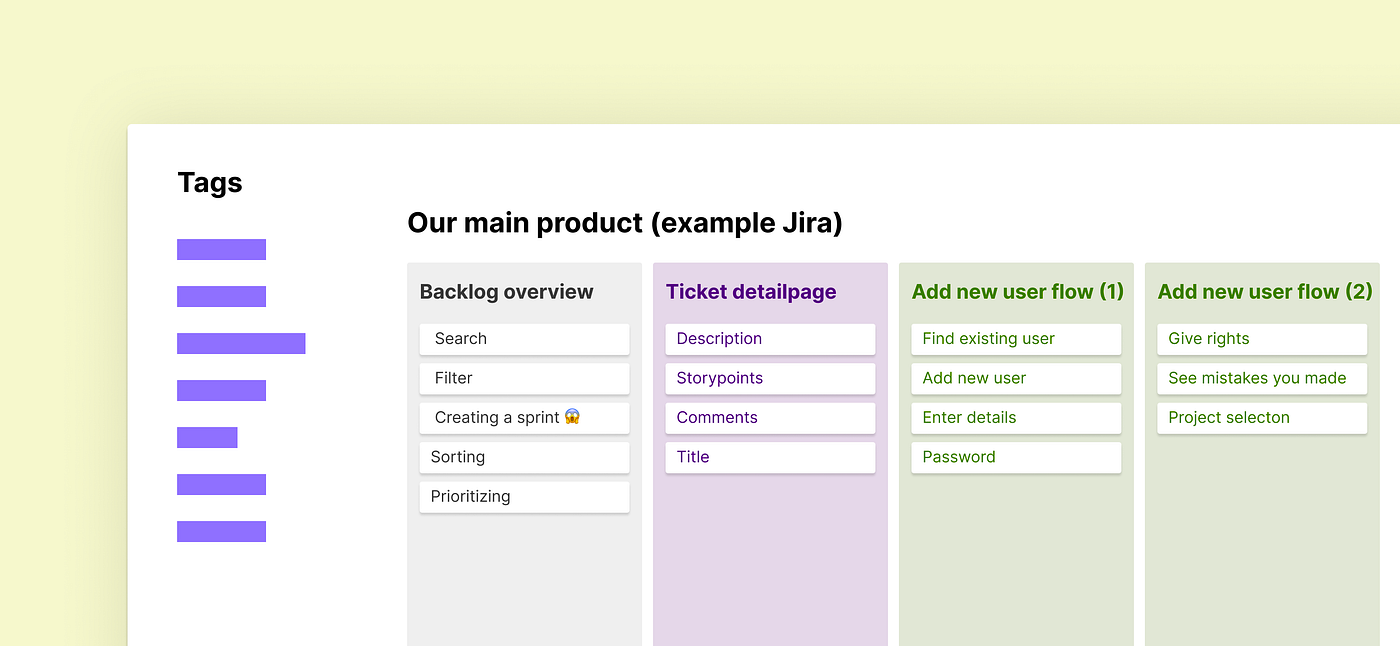
Don’t go overboard with making tags. Start small. When you notice a tag grows too big, you can split it.
3. Import old research
Create a “data” view called “Reports and Analytics” and add columns for each researchtype: interviews, web analytics and old research reports. Don’t overthink this: you’ll get the hang of this grouping soon enough and you can always change later.
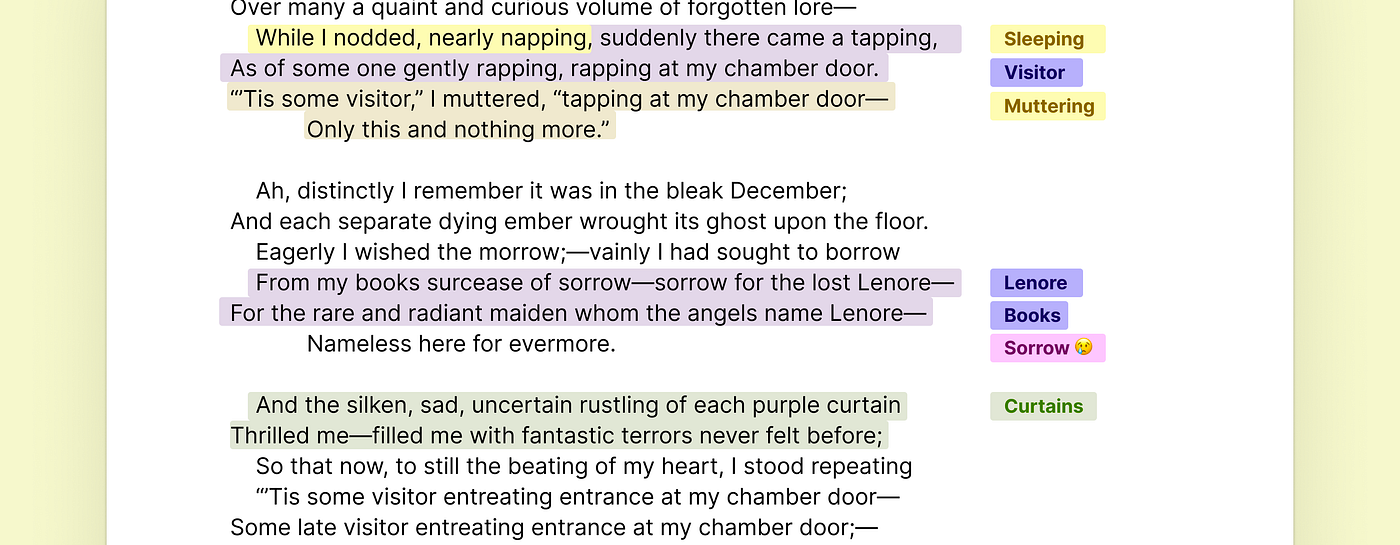
Now you need to fill your database! You can start by adding a recent interview, copy-paste the notes per interview and start tagging. Tagging is simply highlighting a part of the text and selecting a tag from the menu that pops up. Don’t tag single words, but rather whole sentences or even paragraphs. You can (and should!) give your highlights multiple tags. The more connections you make, the easier you will find insights later.
To tag old research reports, I usually cut the report into logical pieces and manually write the conclusions per piece. I then tag these conclusions.
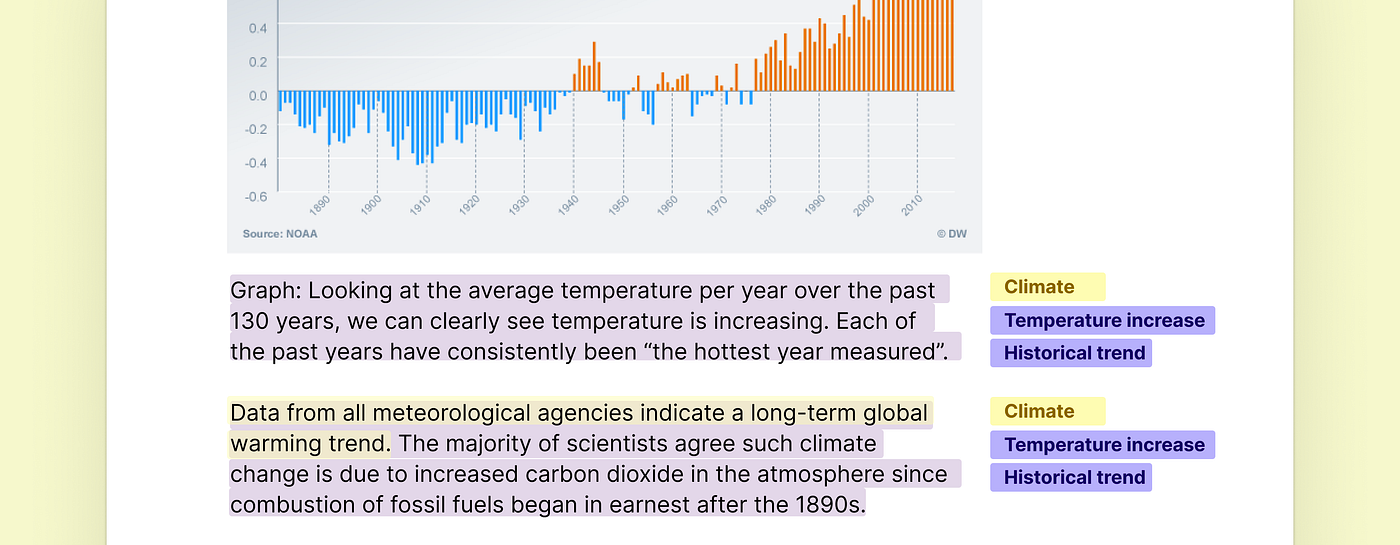
The same goes for web-analytics and survey-data: describe the graph or data, and then tag your description.
You can also import feedback from tools like Usabilla (GetFeedback). These end up in separate notes, which you then need to tag manually. It’s a lot of work, but it’s worth it. Keep in mind how difficult and expensive is it to reach out to your users, so put some effort in when they reach out to you in your feedback tools.
*If this becomes confusing, or you find you grow out of space, you can separate your data in multiple ‘views’. The next step is organizing in multiple projects. Be aware that you have to upgrade to Markup Team to enable ’tag extensions’ to keep the advantage of your information library.
4. Do new research in Dovetail
Now you have the hang of tagging, you should do the analysis of new research in Dovetail as well. You will now see the benefit of all your earlier hard work: old data pops up to support your new research.