Simplify it
To make it more impactful and easier to understand I had to simplify it.
When I was younger I played a lot at Fifa on Playstation. In this game when you are a coach and select your players to create your team, you have that interface with a spider graph in the middle of it. This graph helps you understand quickly the key strengths of your player.

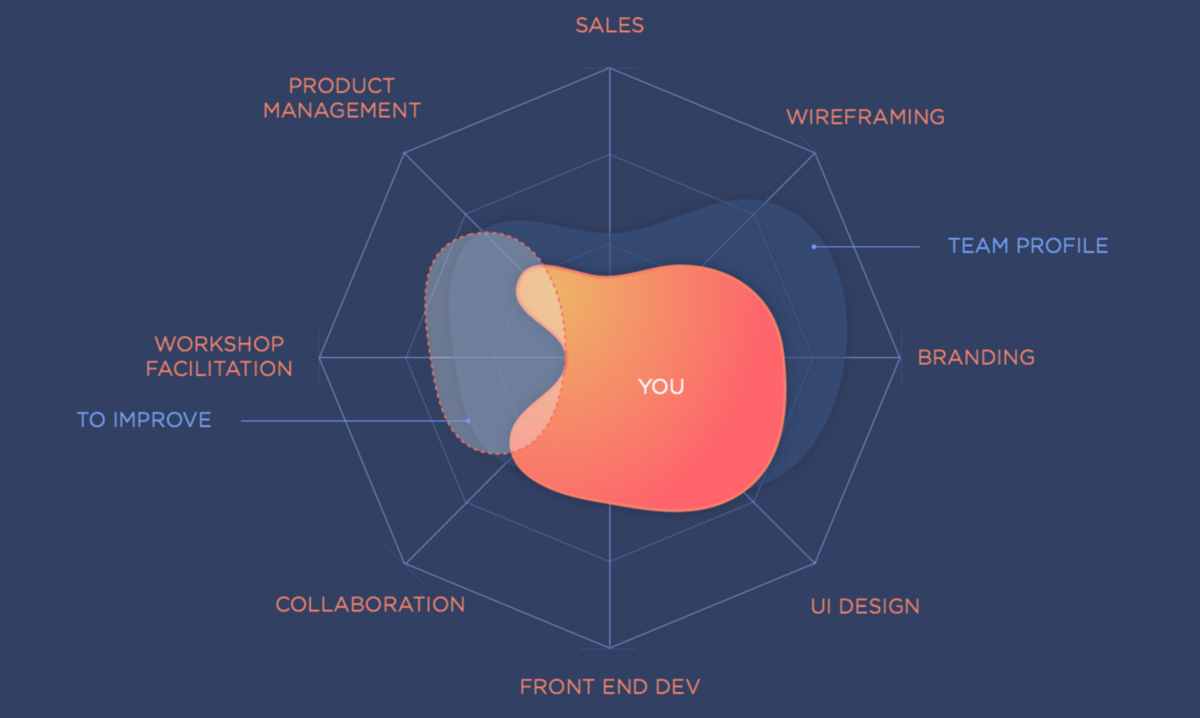
So I started to re-shape my mindmap in a radar chart to make it more simpler to grasp.

The depth represent the expertise level for each designer.
It goes from 0 to 4.
Identify the gaps
Having this represented visually helped me as a manager understand the shape of my team. The goal is not necessarily to cover all areas but have a clear and up-to-date picture of our strengths and weakness.
Most importantly it helped me having the right conversation with my designer so they can picture where they want to grow.
The other advantage of visualising the skills is to help the designer know his/her strengths and weaknesses. And where he/she wants to grow.
It helps me to know how to assign people to a project in a way that is mutually beneficial to the designer (through engagement and growth) and the company (by ensuring the relevant skills/strengths are matched on a project-by-project basis)”.
The other side of the tool
That visualisation tool is in fact a 360 assessment matrix. It gets its value from different ratings (and different weightings depending on the role)

You can use the evaluation tool after each project or during quaterly reviews. Then once the performance is visualised you can easily set up goals and activities with your team
It helps the Designer stay engaged and motivated. They now have a clear goal, a way to visualise their progress and direction.