The most common tool in Chrome Developer Tools is Inspect Element. As we’ve covered, this tool allows you to view the CSS and HTML associated with specific on-screen elements. But there’s more power than that within DevTools. You can also access additional tools to do far more. You can debug JavaScript, monitor network performance, preview media queries and control cookies. And there’s even more than just that! Google lists dozens of functions within DevTools. We’ll look at some of the most useful and popular advanced functions within Chrome Developer Tools.
Using the JavaScript Debugger
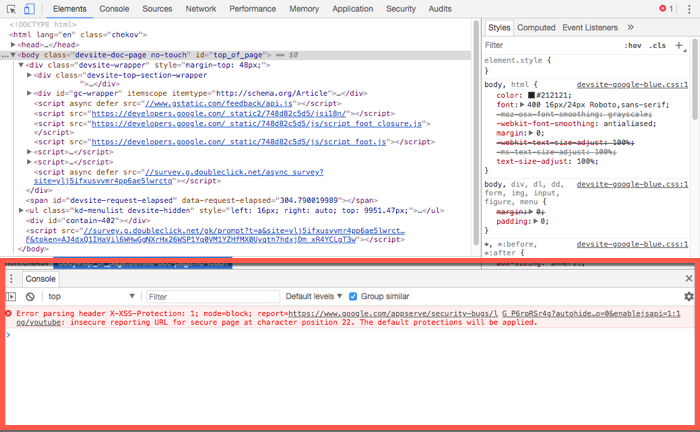
Visiting the Console
Console is probably the second-most commonly-used part of Chrome’s Developer Tools. Using Console, you can view messages posted by your code.
Viewing JavaScript
With the debugger, you can view and adjust your JavaScript in detail. You can learn more about Chrome’s debugger in our introduction.
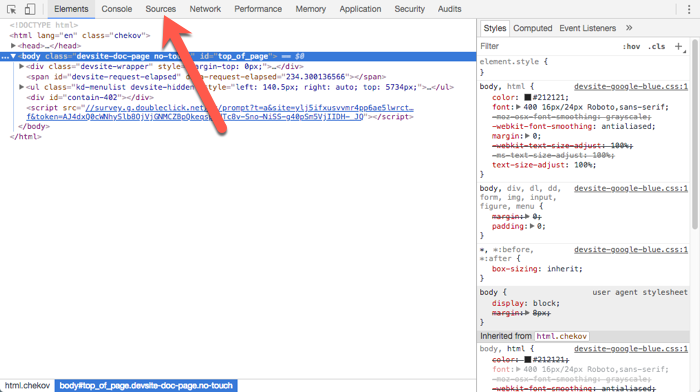
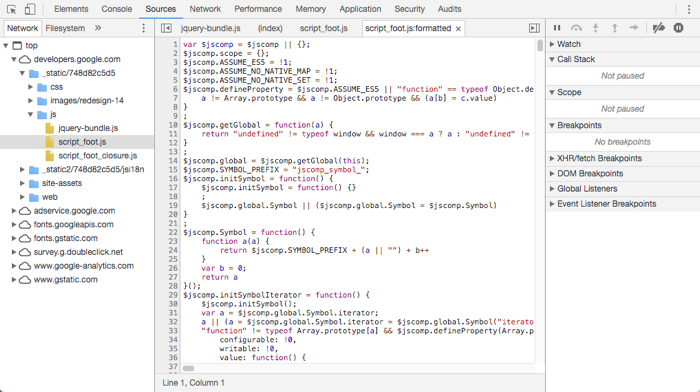
1. Click on the Sources tab in Chrome Developer Tools.
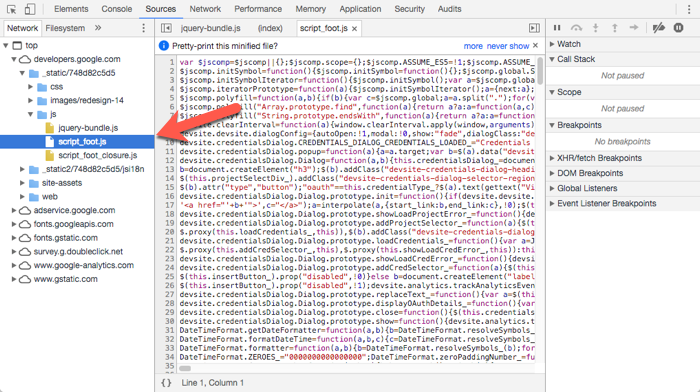
2. Select the appropriate JavaScript file from the left-hand menu pane.
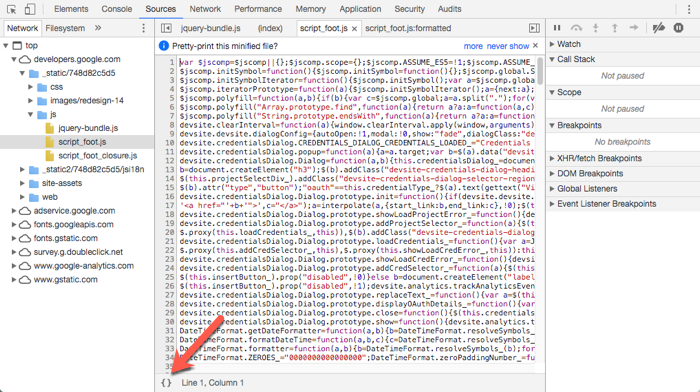
3. JavaScript is often minified before deployment, making it hard to read. If necessary, click the Pretty Print button to de-minify the code.
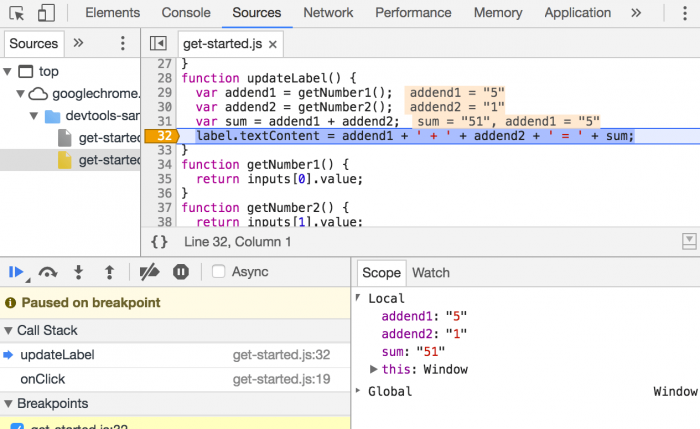
Setting Debugging Breakpoints
Breakpoints are used to “pause” the execution of your code at a certain point. Set a breakpoint, then move through your code gradually to see why things aren’t working as expected.
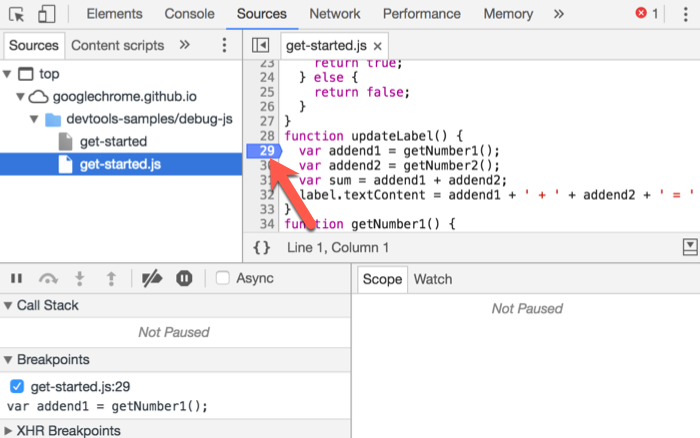
1. Click on the “Sources” tab
2. Select the correct JavaScript file from the menu pane.
3. Click on a line number to set a breakpoint at that line.
Using Conditional Breakpoints
Conditional breakpoints will only trigger when certain conditions are met.
1. Right click on a line number.
2. Select “Add Conditional Breakpoint” from the context menu.
3. Enter your conditions in the dialog.
4. Press “Enter” to activate the breakpoint.
Emulate Devices
Set Media Queries
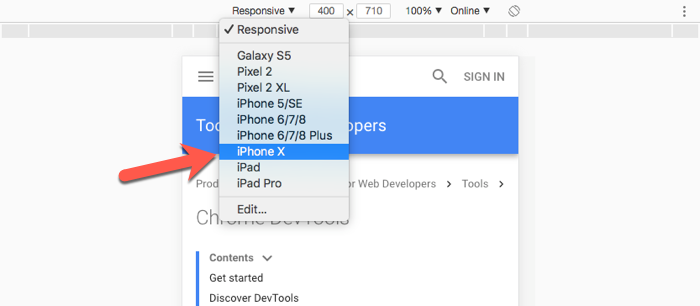
As covered previously, the Device Toolbar can be used to change the viewport size and emulate smaller devices. You can adjust specific pixel dimensions as well as the device pixel ratio to preview appearance. Common devices can be selected from the drop down to test specific devices.
1. Click the Device Toolbar icon or press Command + Shift + M (Mac) or Control + Shift + M (Windows).
2. Adjust viewpoint values directly.
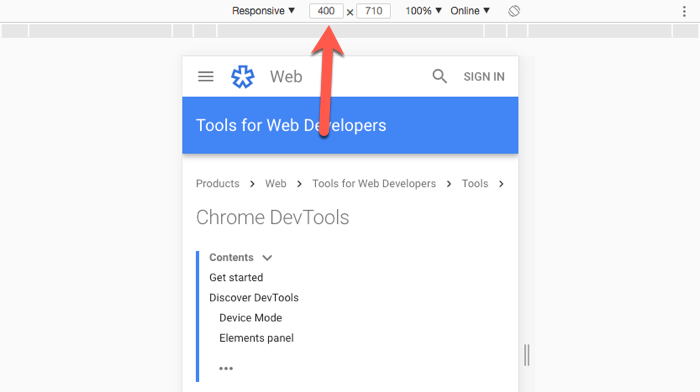
3. Click “Reponsive” to view device presets.
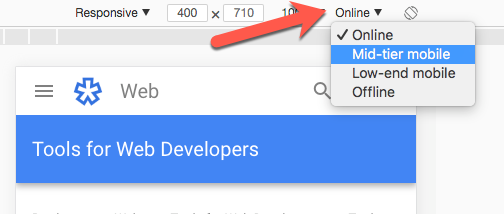
Network Throttling
Use the “Online” dropdown to emulate various network conditions. This helps simulate poor connectivity or slower connections.
Emulating Sensors
If your site is responsive to accelerometer or geolocation values, you can emulate those device sensors from within Chrome Developer Tools.
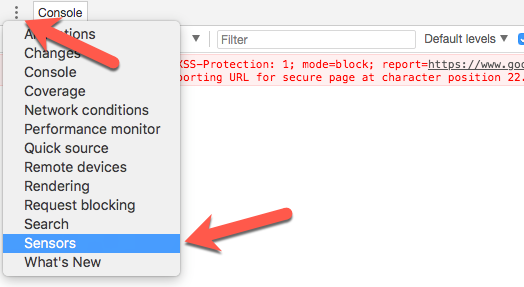
1. While in the Elements panel, press the “Escape” key to open the Console Drawer.
2. Click the menu dots and choose “Sensors.”
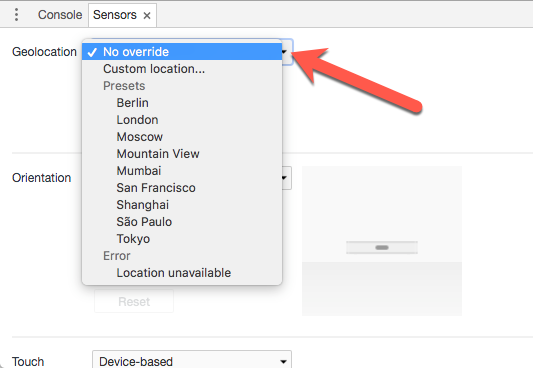
3. Click the dropdown to select a geographic location, or select “Custom location” and enter specific GPS coordinates.
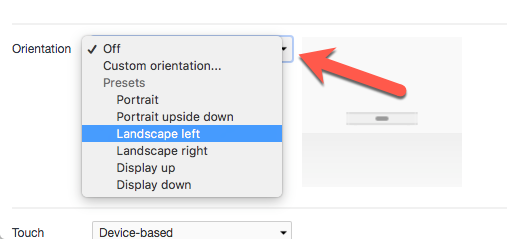
4. Click the dropdown to select a device orientation, or select “Custom orientation” and enter your own degree values.
Monitor Network and Performance
We can use DevTools to monitor network performance and bandwidth utilization. This can help us get a sense of what’s slowing down our site and how to improve our performance.
Network Filmstrip
The filmstrip will capture screenshots of your webpage as it loads. This will help record the elements that have been loaded so far, making it easier to understand what the site resources are loading.
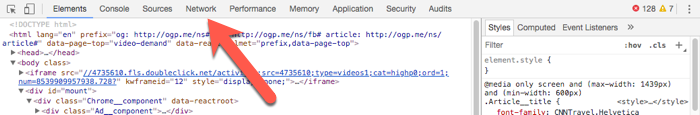
1. Click on the Network tab.
2. Click on the camera icon.
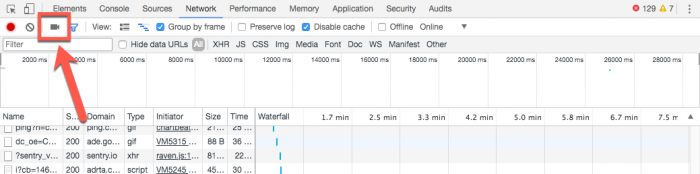
3. Press Command + R (Mac) or Control + R (Windows) to reload the web page and capture the filmstrip.
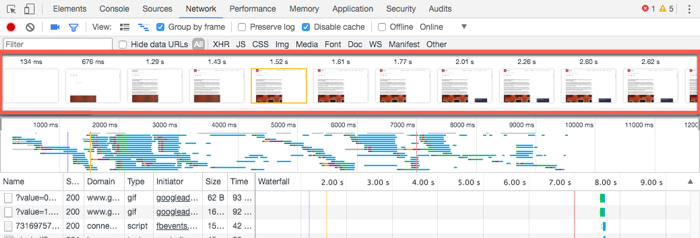
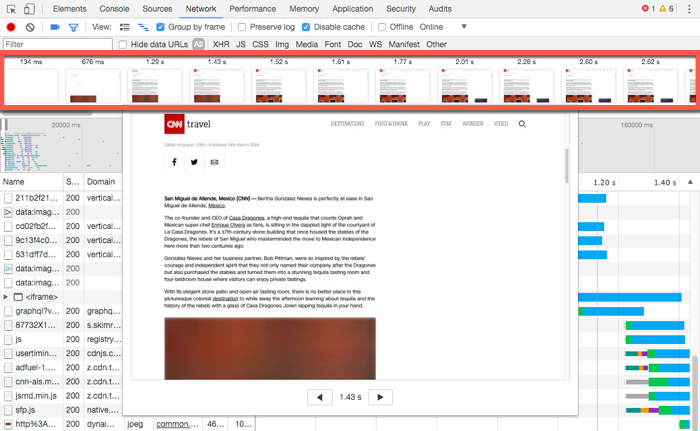
4. Review the results below. Double-click on an image to zoom in and see what elements have loaded at that point.
Analyze Site Performance
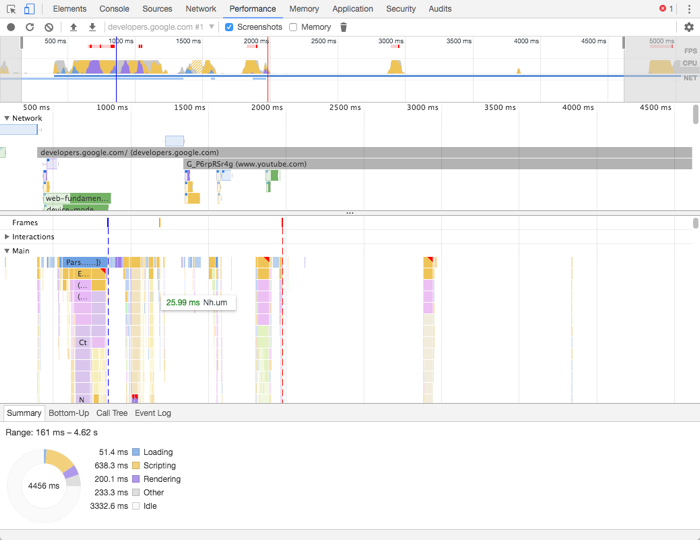
The performance tab captures more than the loading order. This lets you analyze frames per second and CPU load, finding bottlenecks more quickly.
1. Click on the Performance Tab.
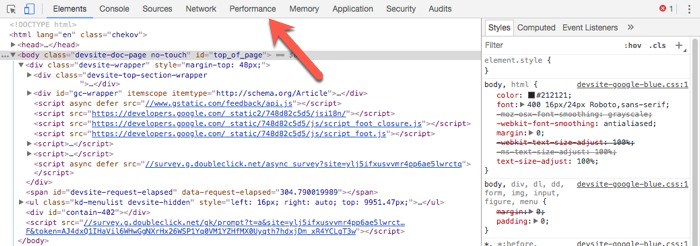
2. Click the “Reload” icon to reload the page and record performance characteristics.
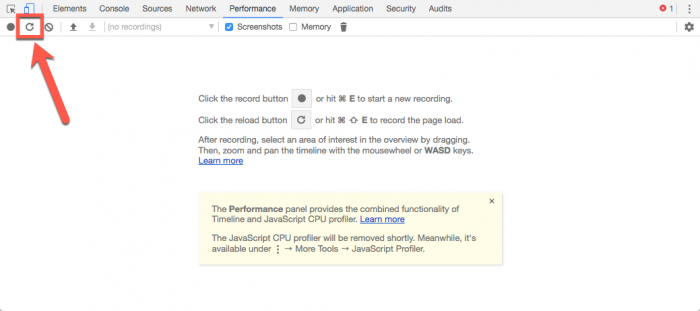
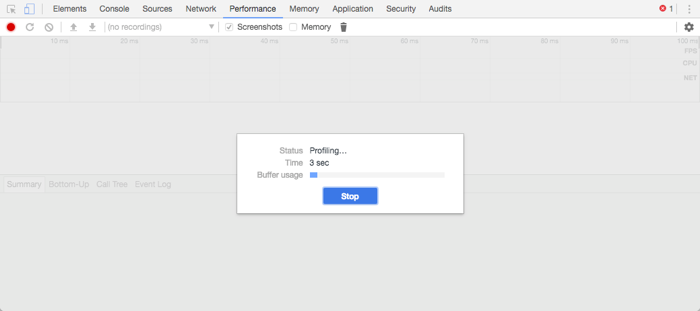
3. Wait for the performance recording to finish.
4. Review the performance results and graph.
You can also record mid-page performance for web application. Click the “Record” icon to arbitarily capture performance data (click Stop when you’re done.) This will record animation performance, letting you capture results with user input without reloading the page.
View Local Storage and Cookies
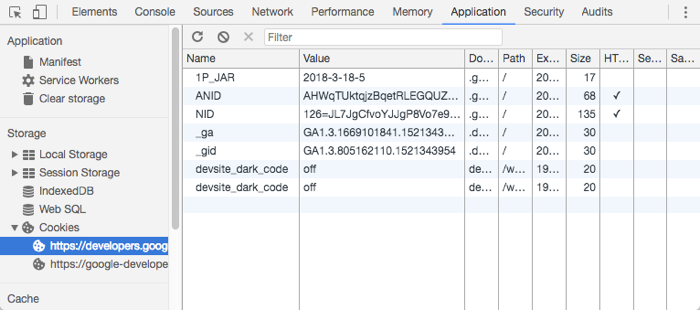
Viewing Cookies
1. Click on the Applications tab.
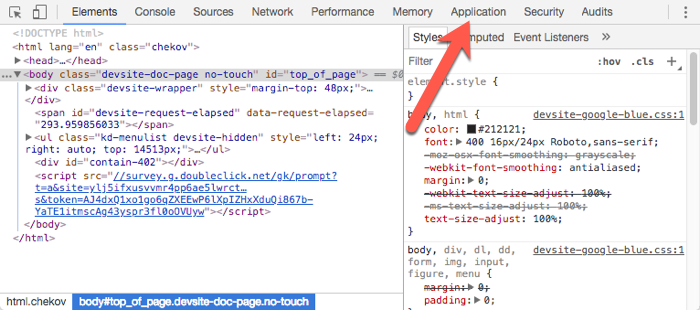
2. Navigate the sidebar to find the “Cookies” dropdown.
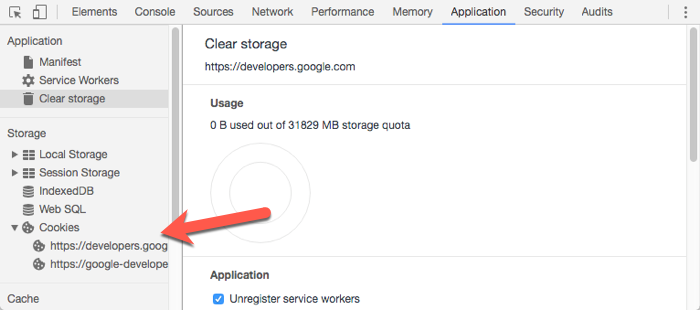
3. Disclose the cookies list and select a cookie to view.
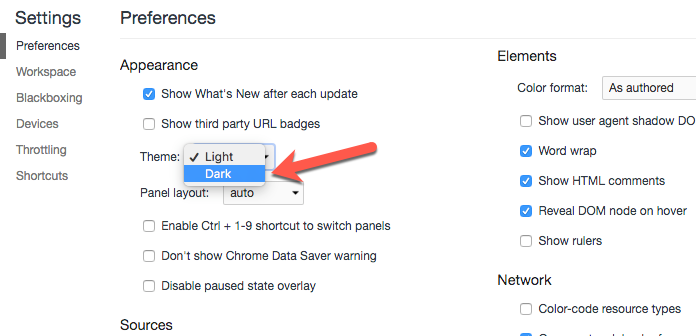
Set Dark Mode
1. Click the menu dots.
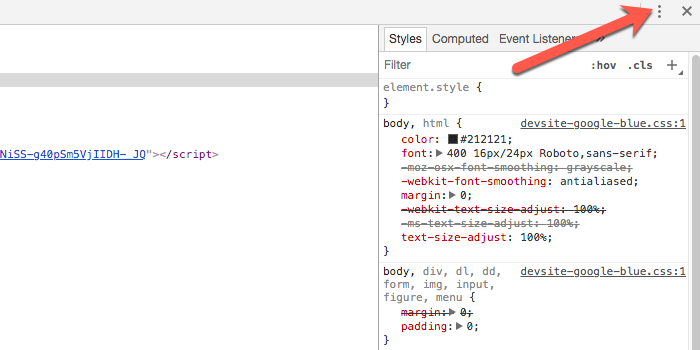
2. Choose the “Settings” menu.
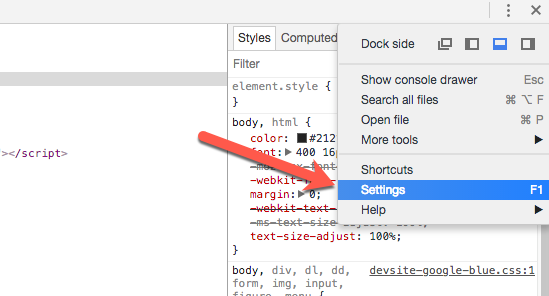
3. Select “Dark” under Theme in Appearance.
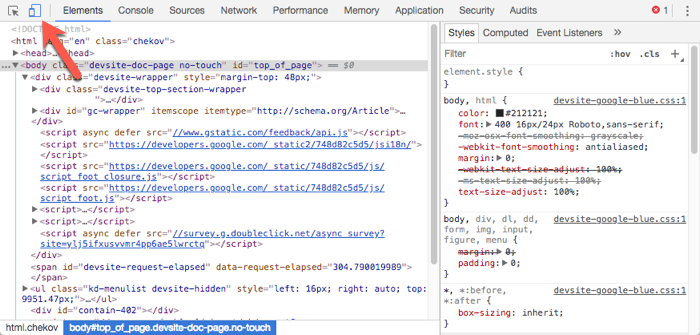
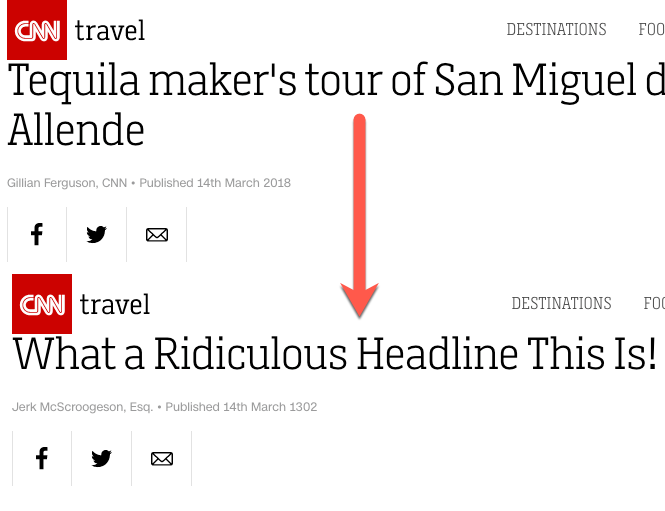
Honorable Mention: Changing Content
While it’s useful to adjust your HTML on the fly, you can also have some fun with it. It’s easy to adjust site content as well, meaning you can create fake news stories and fake headlines while maintaining the parent site’s styling rules. Talk about Fake News.
1. Double-click on an HTML element to edit it.
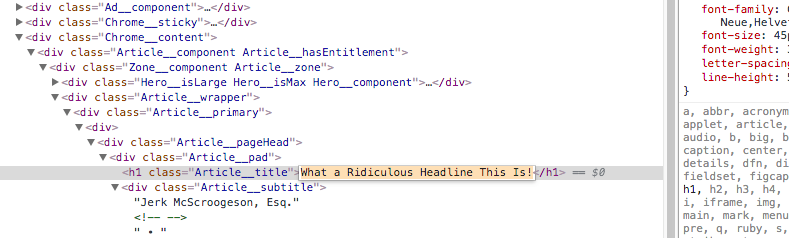
2. Type your new content.

3. Profit?
Conclusion
There’s even more you can do with the Chrome Developer Tools. Examine Google’s own documentation to see what kind of power is available to you.
You might also like the following posts: